Bias and Variance
In the previous post, we’ve learned two common problems from models “Overfitting” and “Underfitting” when validating them.
If you are not sure about this topic,
check here: Overfitting and Underfitting in terms of Model Validation
We saw the overview of the relationship between overfitting/underfitting and bias/variance in the previous post:
- Overfitting: A model with low bias and high variance
- Underfitting: A model with high bias and low variance
- Optimal fitting: A model with low bias and low variance
In this post, we will learn:
- What are Bias and Variance
- How they connect with overfitting and underfitting.
The ultimate goal of our machine learning task here is:
- Goal: Finding the best model to predict the height of a mouse based on its weight.
The whole dataset we got looks like below.
We can imagine that every gray dot in the graph represents every mouse.
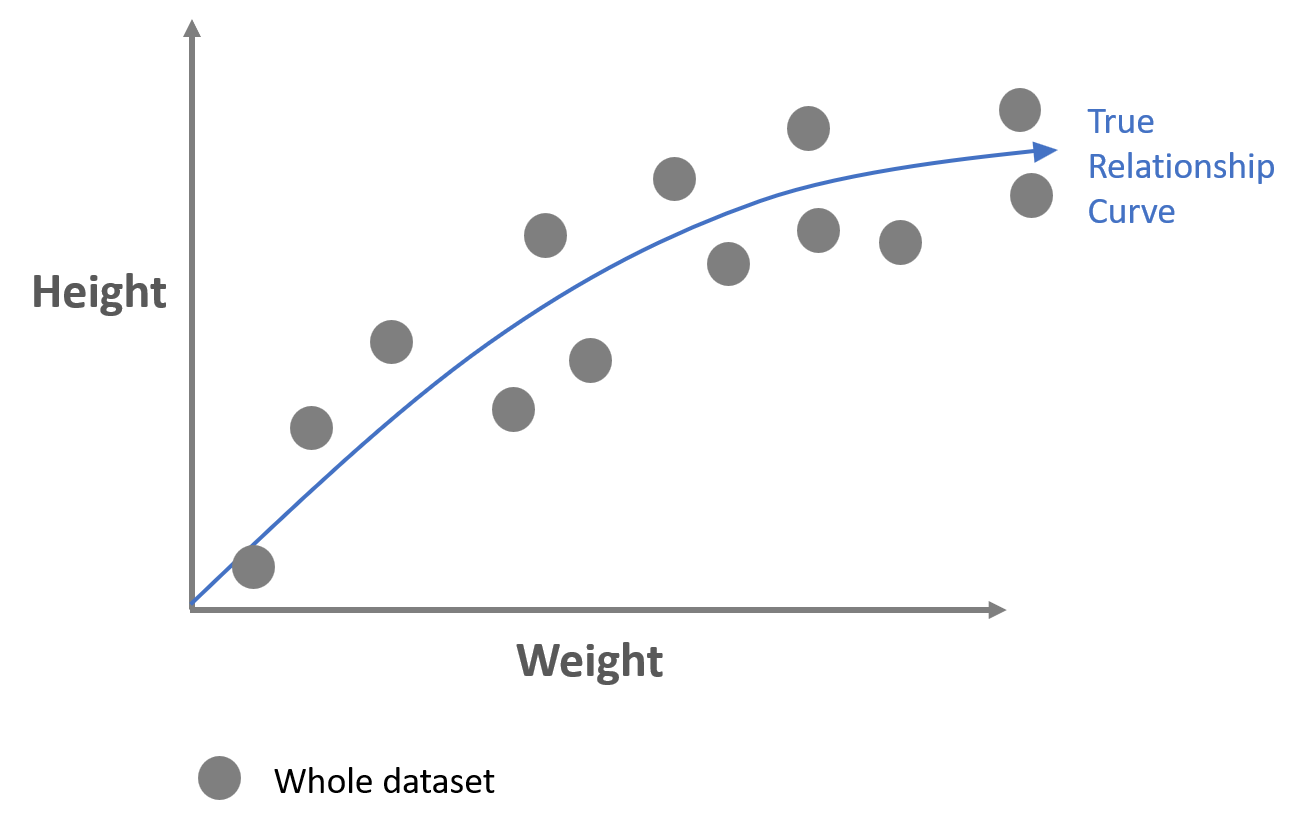
Given this whole dataset, we would like to find the best model to predict the height of a mouse given its weight.
The best model will capture the true relationship curve as shown in the graph above.
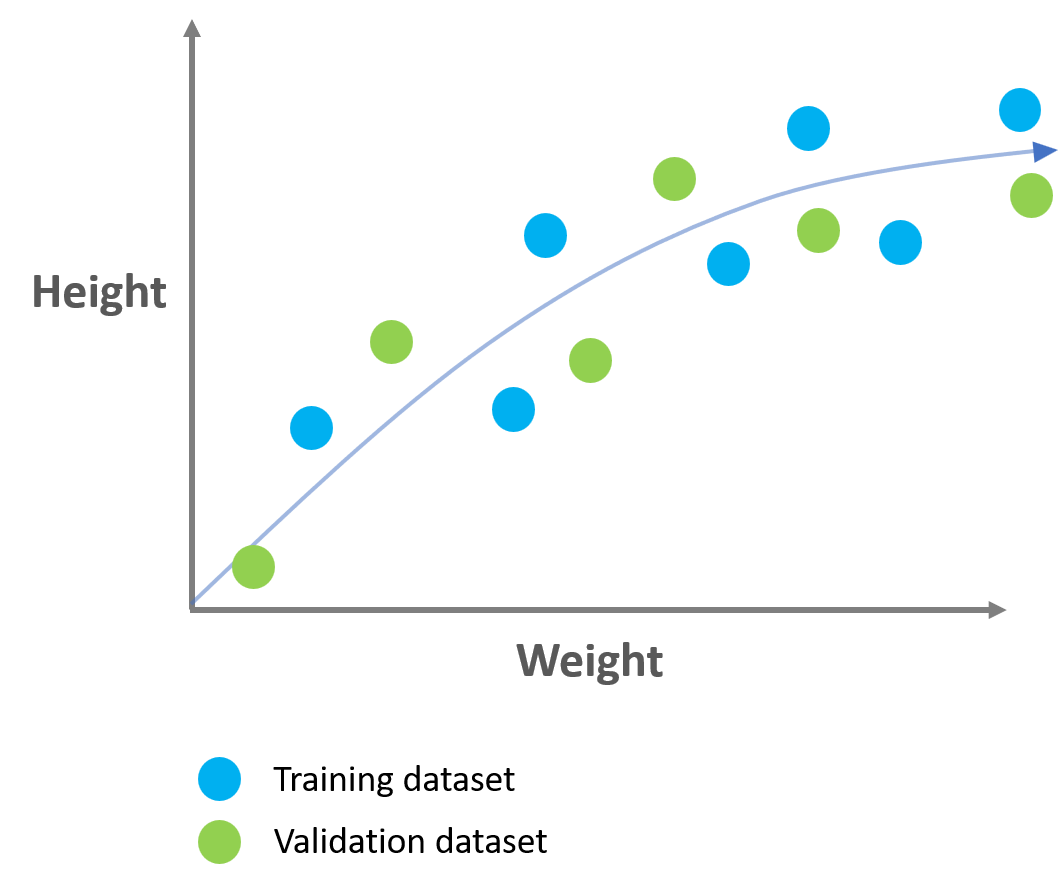
STEP 1. Splitting the dataset
For training and validating models, we need to split the dataset into training and validation dataset.
If you are not sure about why and how we split the dataset,
check here: Training, Testing and Validation Datasets in Machine Learning
STEP 2. Training the models
We have two trained models on the training dataset as follows:
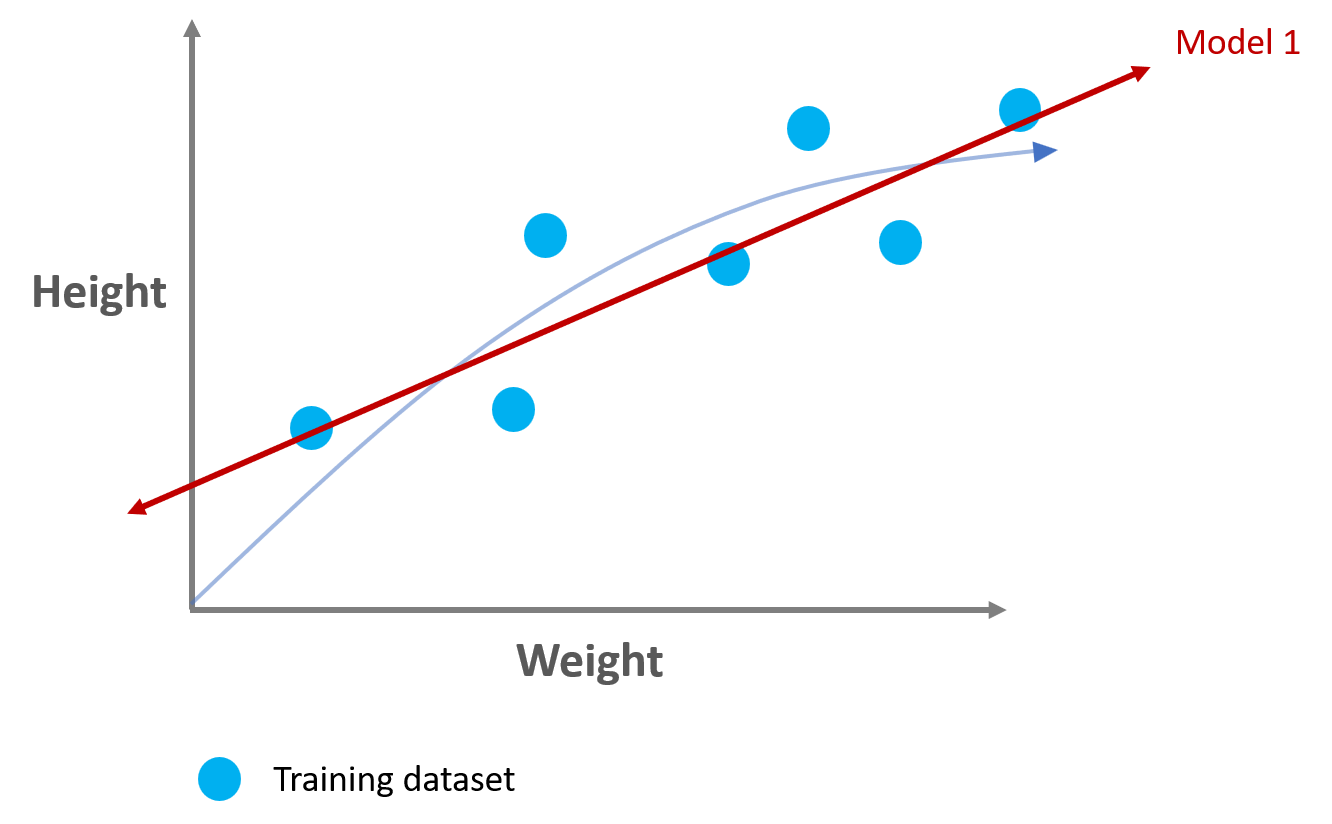
- Model 1
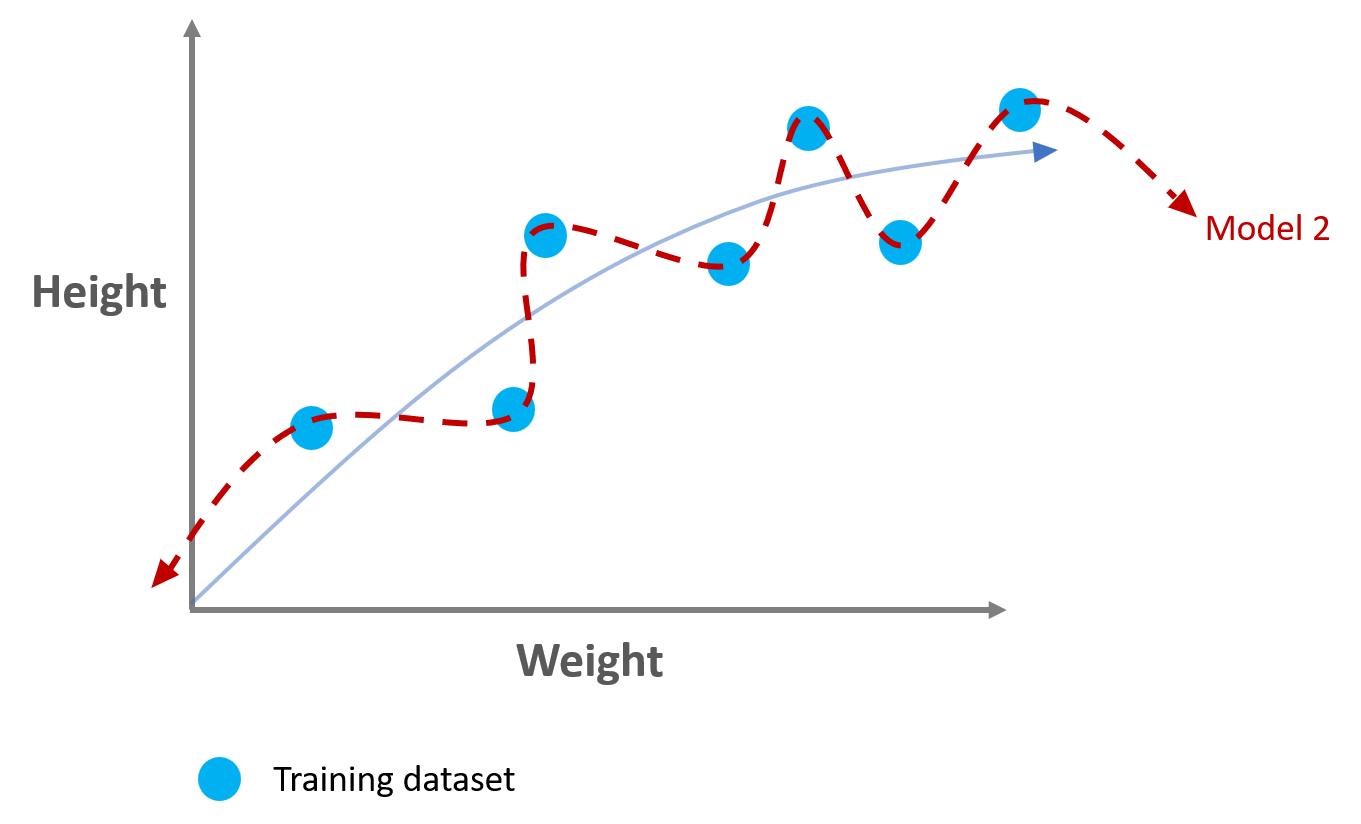
- Model 2
Bias
Bias is the inability to capture the true relationship during training process.
- High Bias means that a model could NOT capture the true relationship during training process.
- Low Bias means that a model could capture the true relationship WELL during training process.
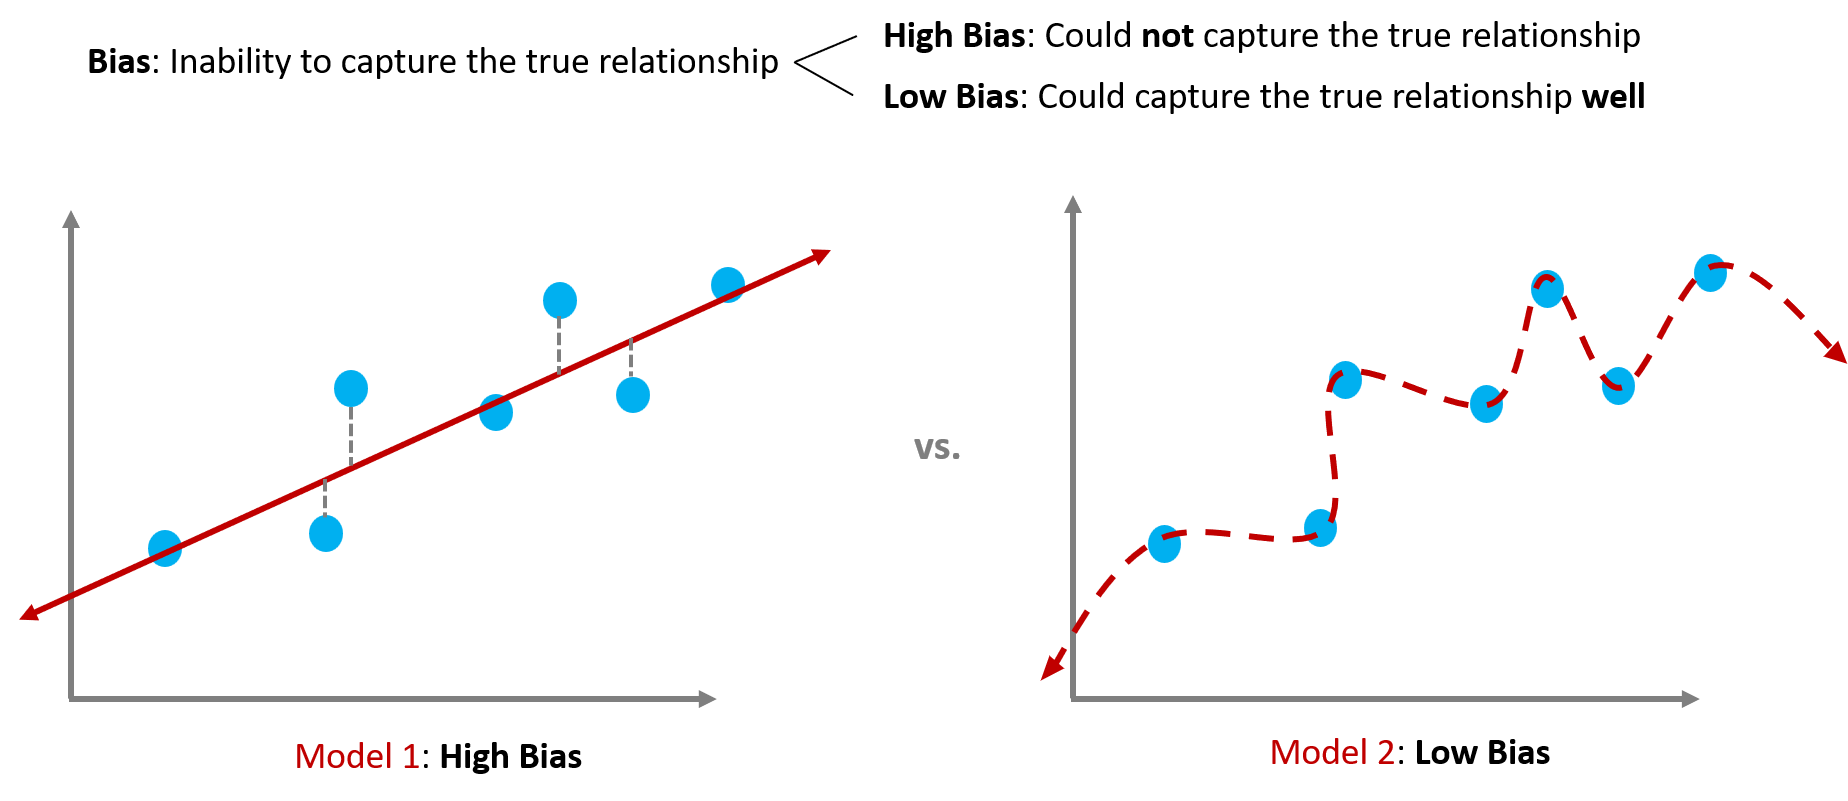
Model 1 shows high bias because it could not capture the relationship between the hight & weight from the training dataset.
Model 2 shows low bias because it could capture the relationship between the hight & weight from the training dataset.
But maybe too well!
STEP 3. Validating the trained models
Now it is time to validate the trained models to see if it will work well on the unseen dataset (test dataset) in the last step.
Variance
Variance refers to the differences in fits between datasets (in our case, between training and validation datasets).
- High Variance means that the differences of a model’s fits are HIGH between training and validation datasets.
- Low Variance means that the differences of a model’s fits are LOW between training and validation datasets.
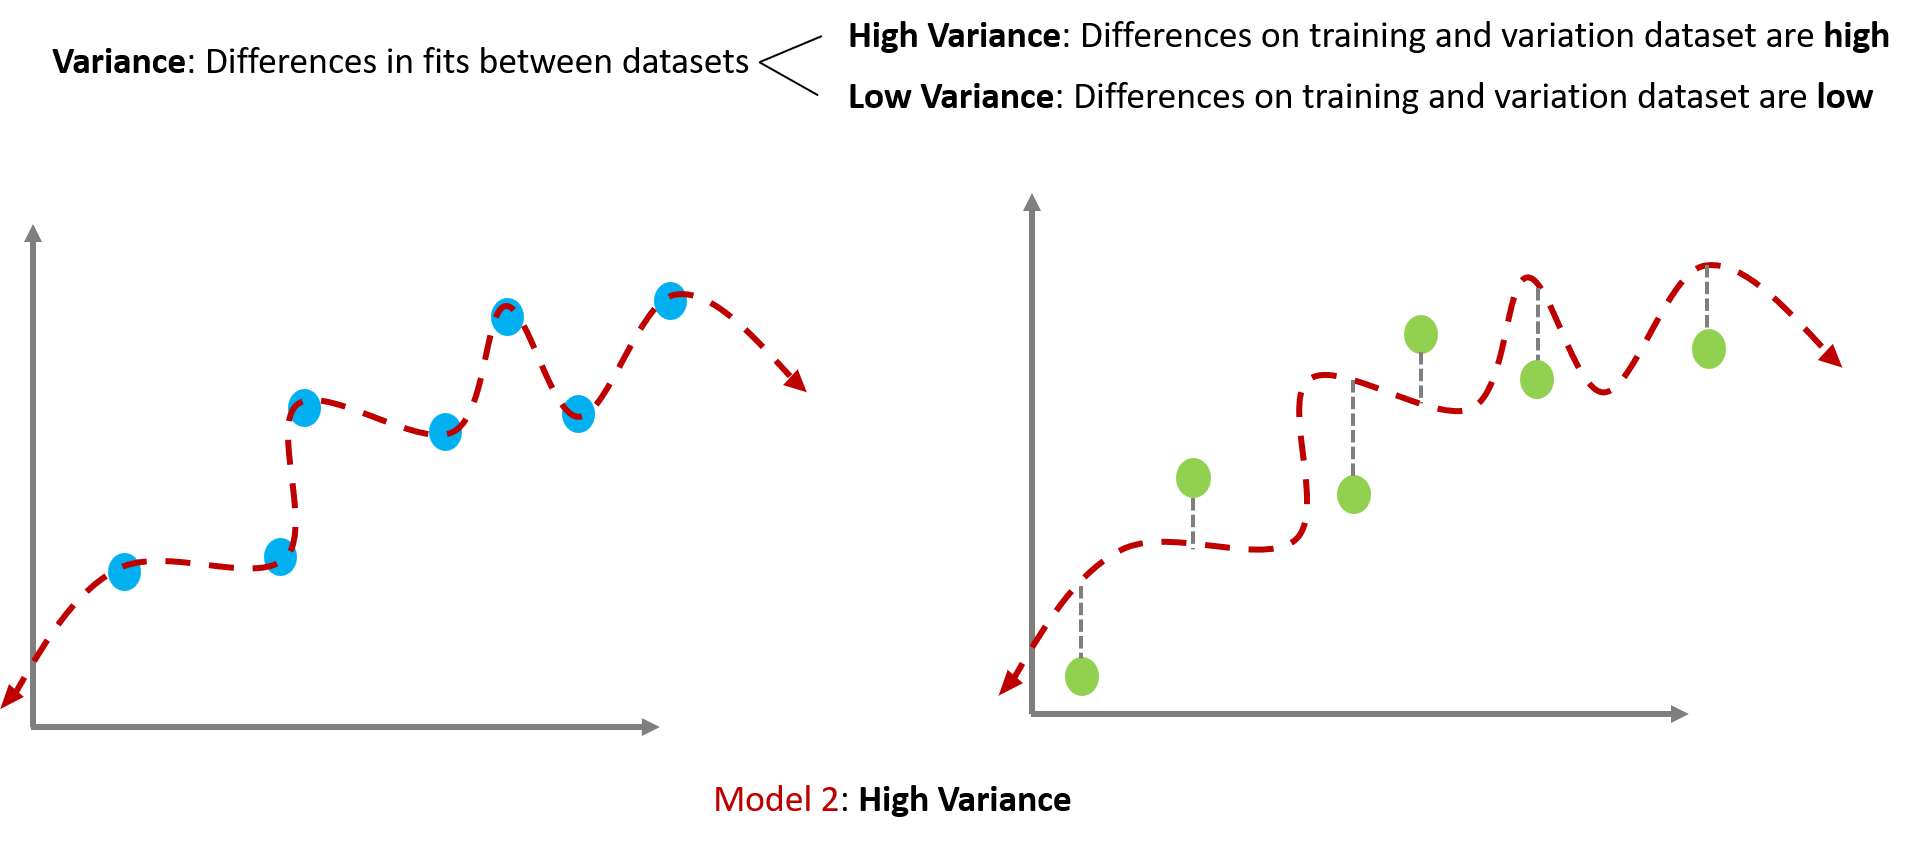
Model 2 shows high variance because its fits beween training and validation datasets are quite different. It worked well on training dataset but bad on validation dataset.
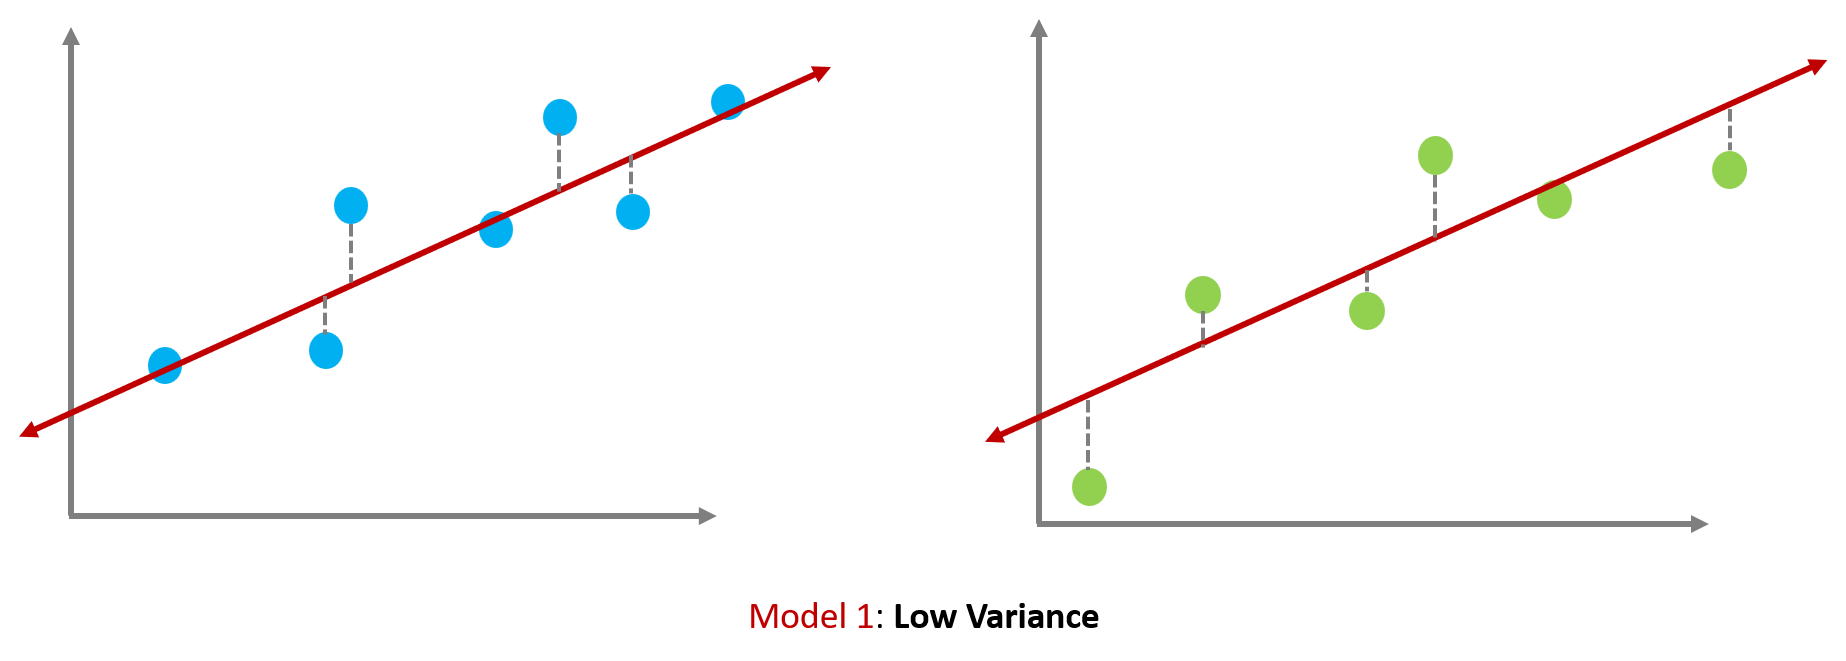
Model 1 shows low variance because its fits beween training and validation datasets are quite similar. It worked ok both on training and validation datset. But not great.
Now, we can understand the relationship between overfitting/underfitting and bias/variance.
Model 1 has high bias & low variance showing underfitting.
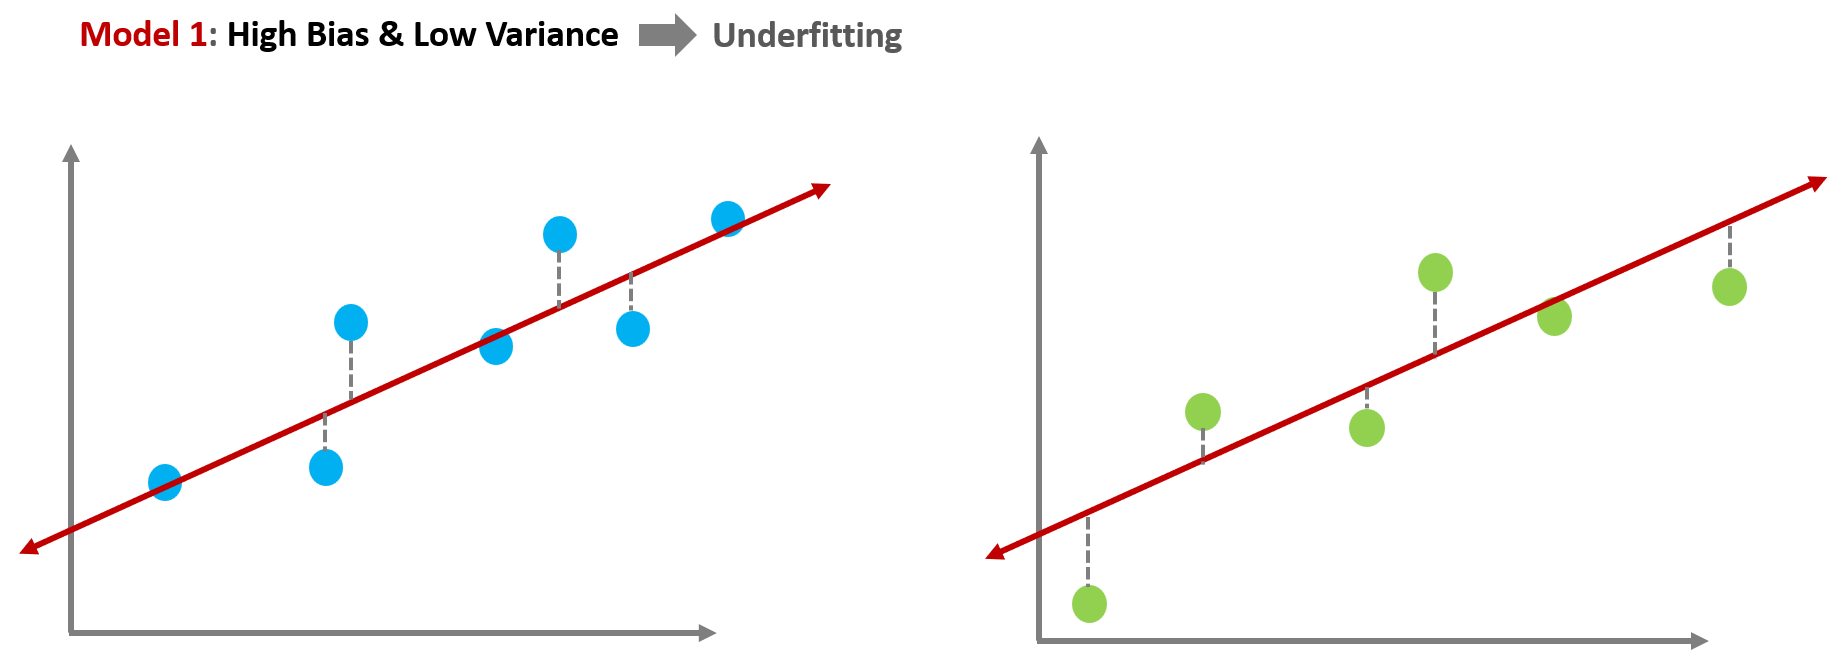
Model 2 has low bias & high variance showing overfitting.

It is hard to find a perfect model having low bias & low variance because the two concepts have a trade-off relationship.
What we need to do is to find the sweet spot between a simple model (Model 1) and a complex model (Model 2).
Then how can we find the best model showing the optimal fitting by preventing overfitting and underfitting?
In the next post, we will learn:
- How we prevent for a model to show Overfitting
- How we prevent for a model to show Underfitting
References
- Reference1: Machine Learning Fundamentals: Bias and Variance
- Reference2: Overfitting and underfitting in machine learning
- Reference3: Overfitting and Methods of Addressing it
- Reference4: What is Overfitting in Computer Vision? How to Detect and Avoid it
- Reference5: What is underfitting and overfitting in machine learning and how to deal with it.