Macro vs. Weighted Average in a Classification Report of scikit-learn
We’ve learned how to evaluate the performance of a trained model for multiclass classfication problem.
And the way we calculated the average of precision and recall are called “Macro Average”.
If you are not sure how we can evalute a trained model for multiclass classification problem,
check here: Evaluation of a model for classification problem (Part 2)
With “Macro averaging”, we calculate the avarage of a metrics without concerning the weights of each class.
But what if the training data are imbalanced per class?
For this case we use “Weighted averaging” method.
In this post, we will see the difference between Macro and Weighted average using the “Classification Report” provided by scikit-learn.
At the end of the article, we can answer to the questions:
- How can we read Classification Report from scikit-learn?
- How can we calculate Macro average and Weighted average of three metrics: “Precision”, “Recall” and “F1-score”?
Multiclass Classification Problem
For the multiclass classification problem, we have a “image recognizer” for animals as our trained model.
The goal of our model is to recognize images according to types of animals.
We have total three types of animals to be recognized:
- CLASS 1: “Cat”
- CLASS 2: “Fish”
- CLASS 3: “Dog”
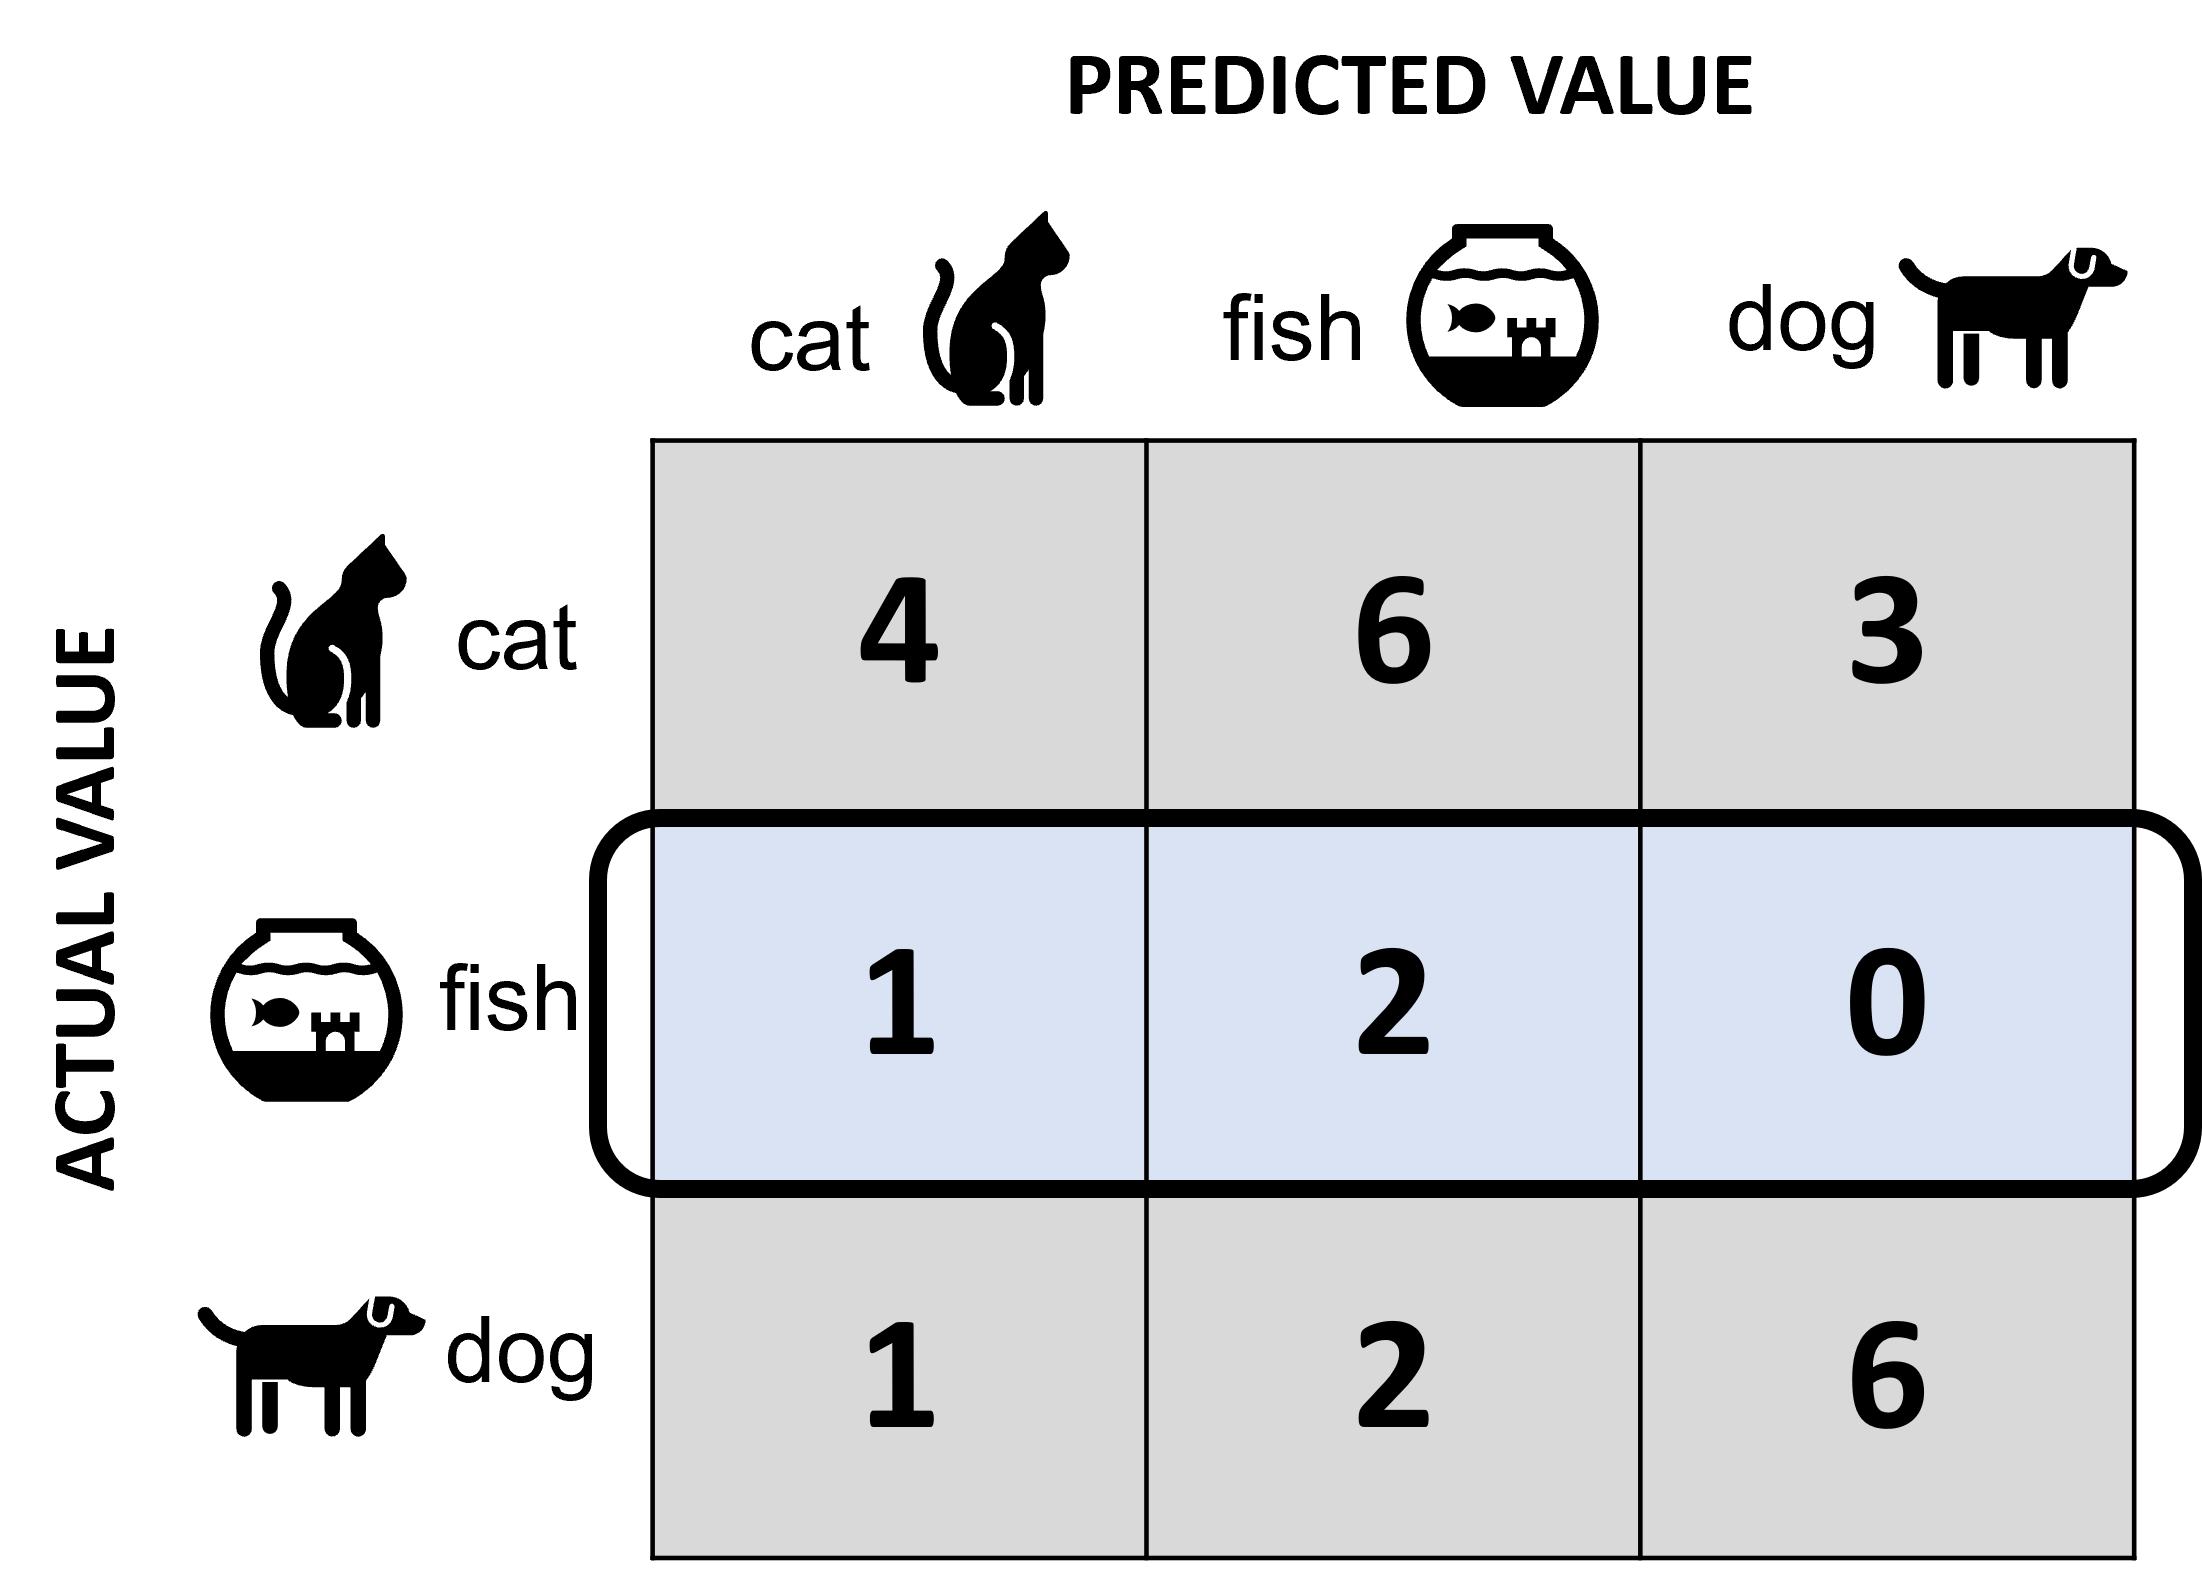
The following confusion matrix shows that our trained model classified total 25 images (sum of all cells) according to three classes.
If you are not sure about what the confusion matrix is about,
check here: Evaluation of a model for classification problem (Part 1)
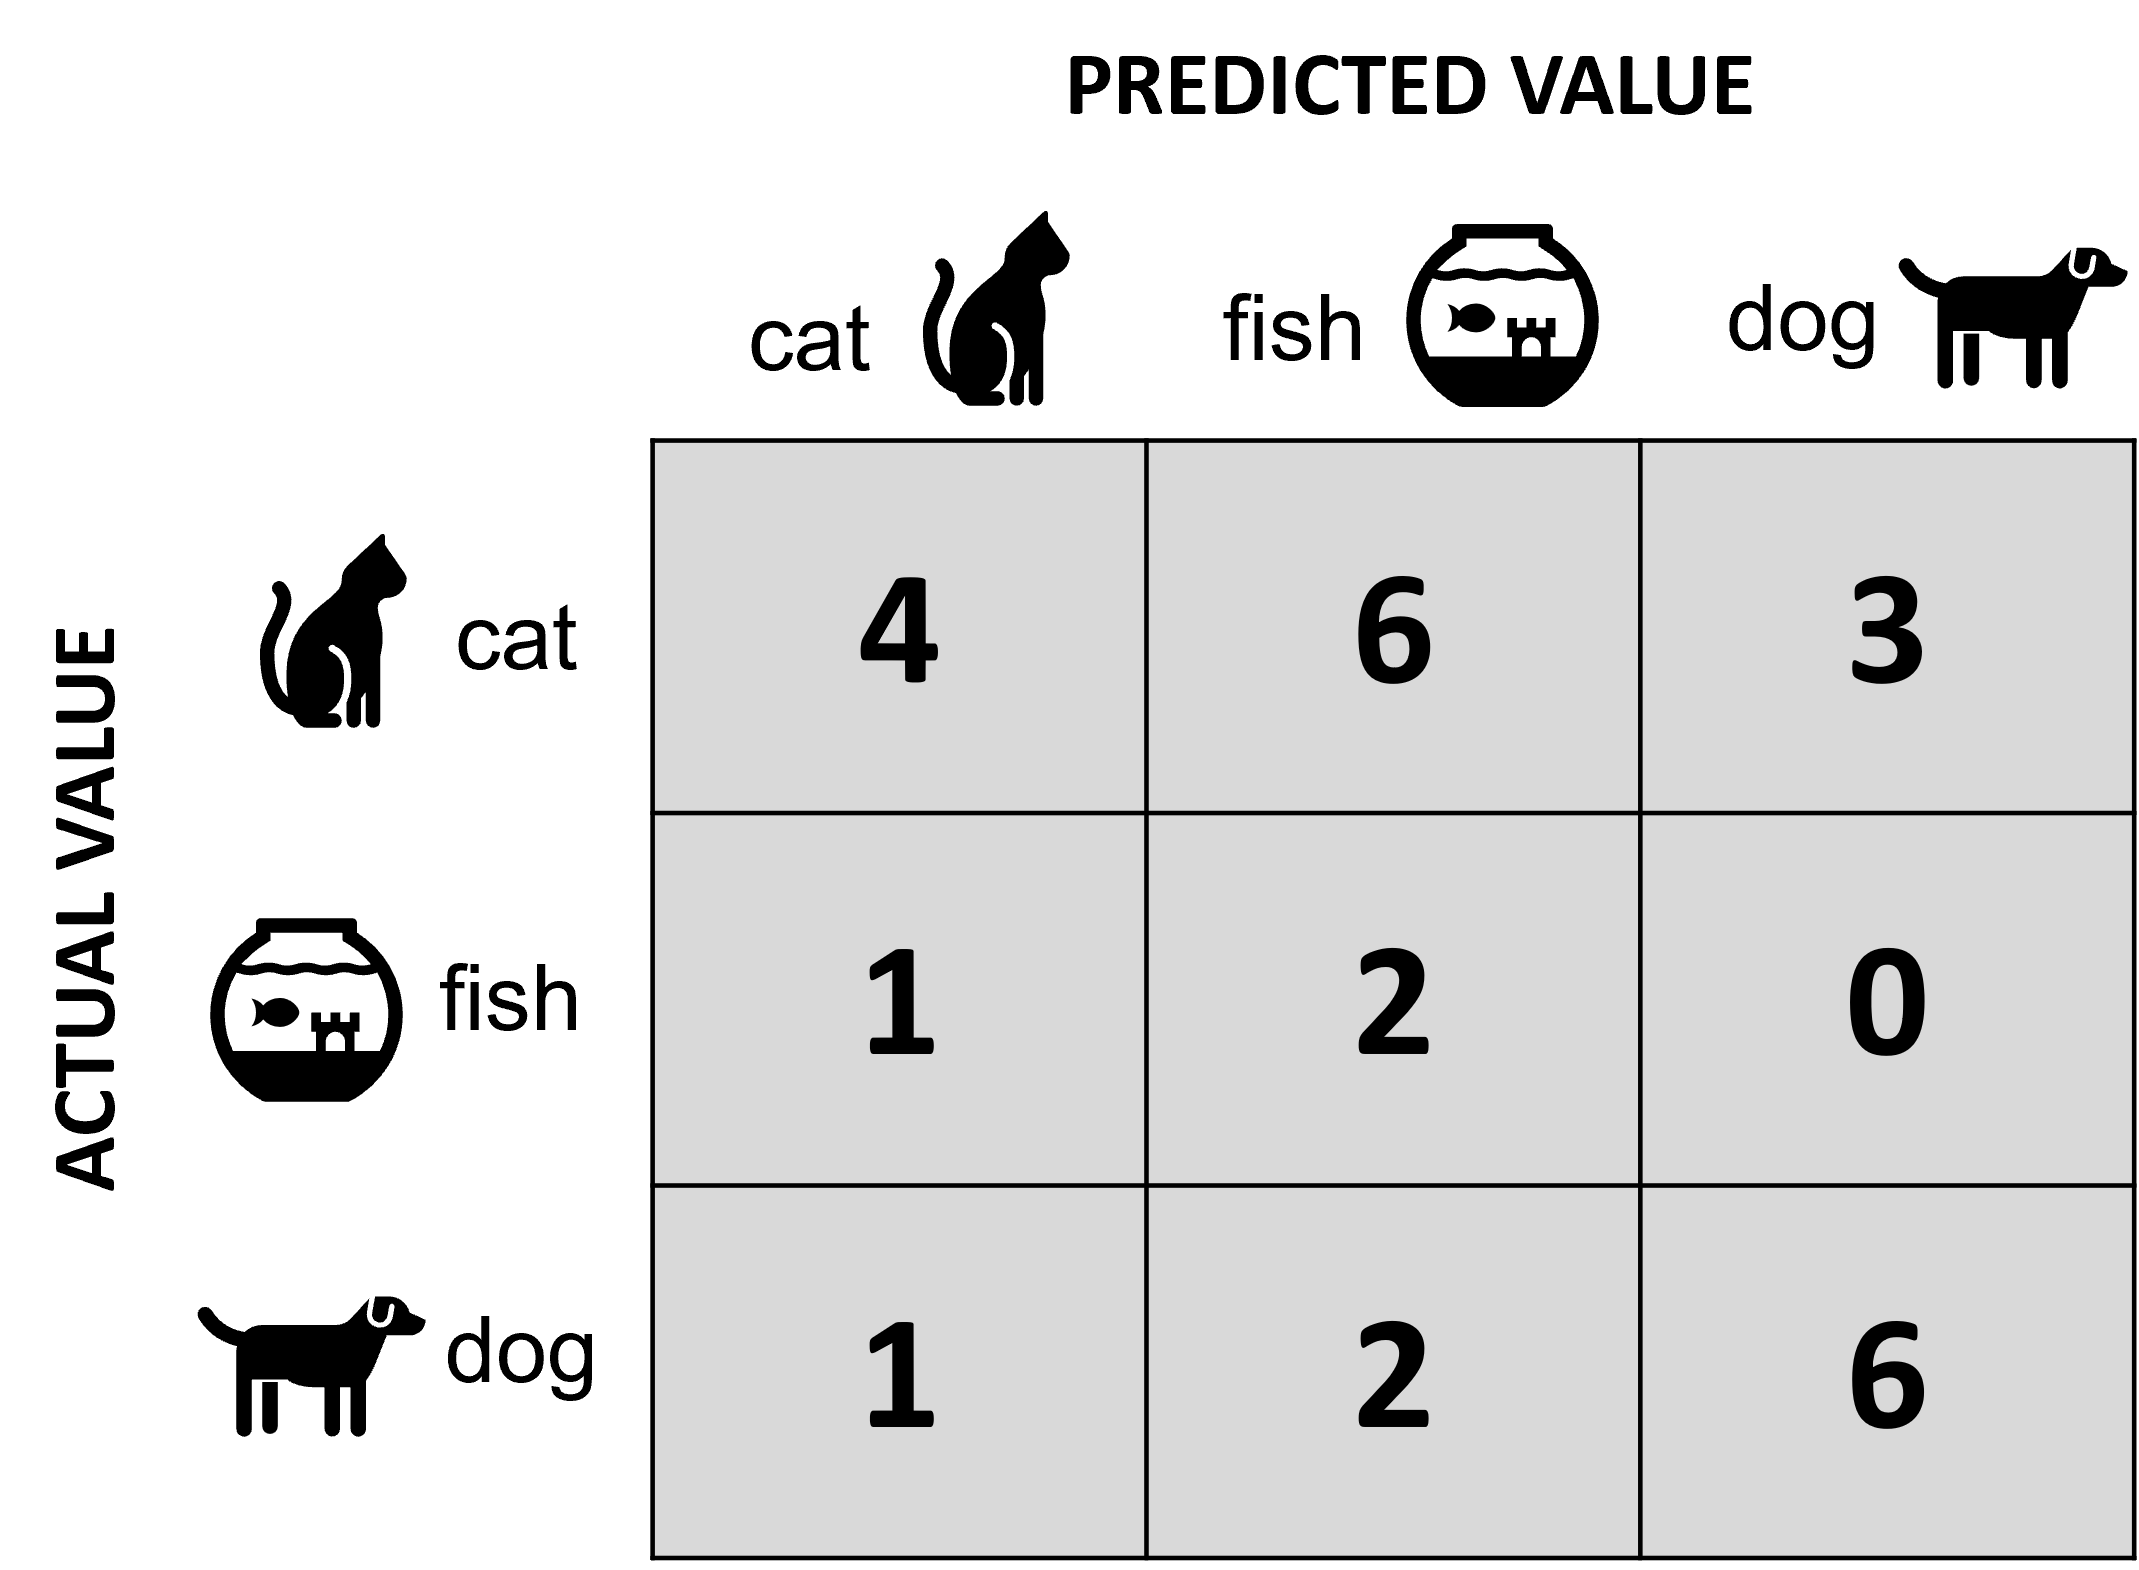
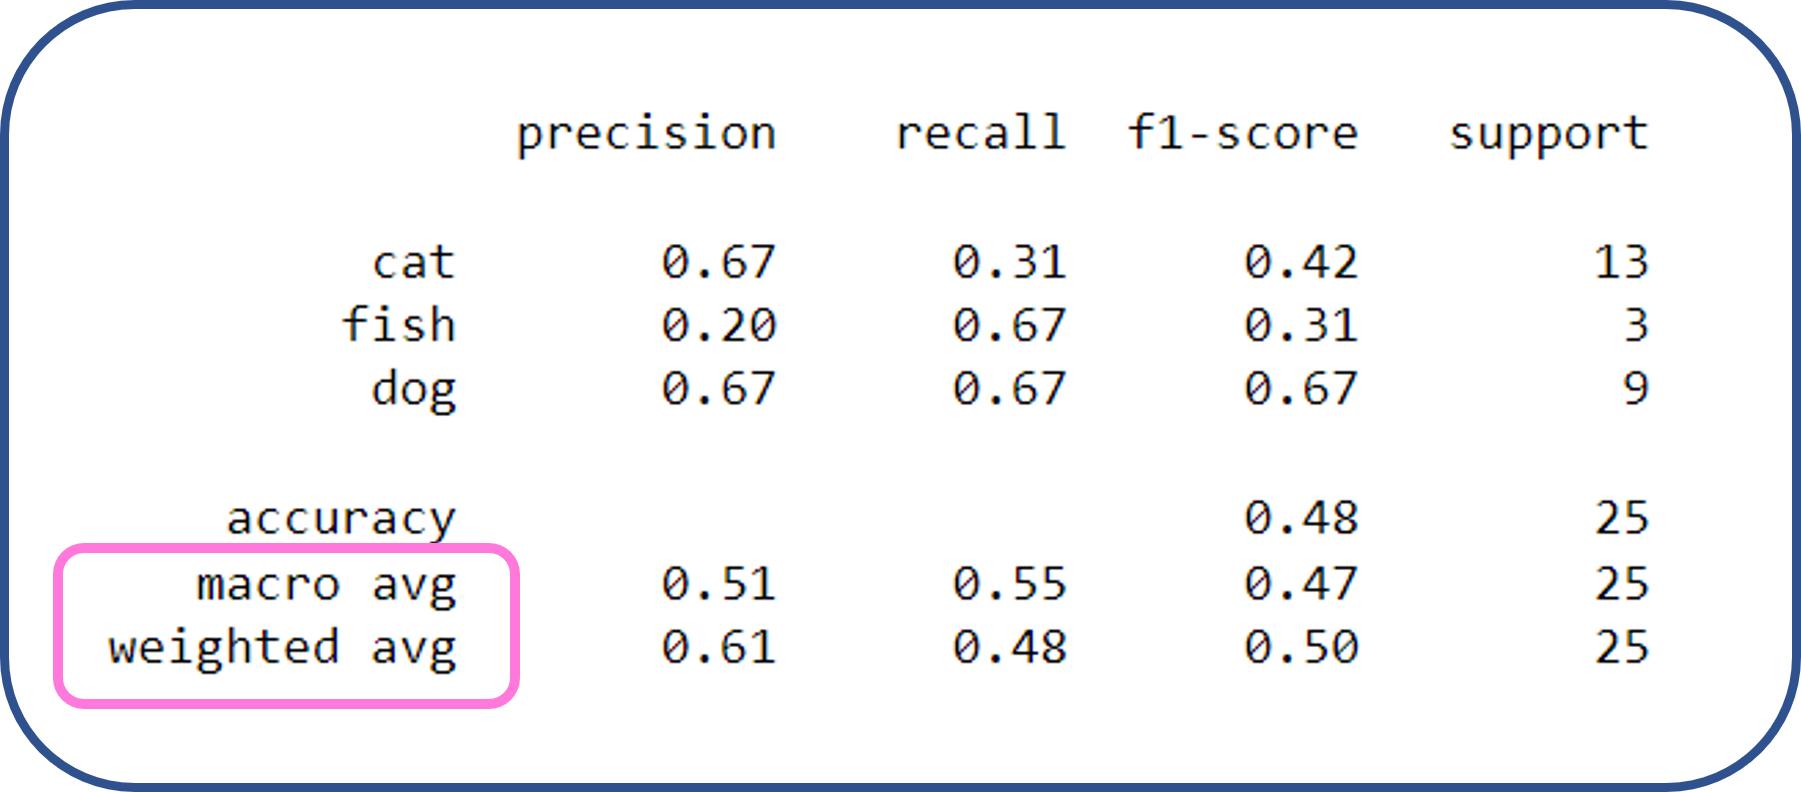
With the Classification Report in scikit-learn, we can calculate the performance of the trained model based on the confusion matrix:
from sklearn.metrics import classification_report

# "y_pred" corresponds to the vertical line of the confusion matrix above ("PREDICTED VALUE")
y_pred = ["cat", "cat", "cat", "cat", "cat", "cat", "fish", "fish", "fish", "fish", "fish", "fish", "fish",
          "fish", "fish", "fish", "dog", "dog", "dog", "dog", "dog", "dog", "dog", "dog", "dog"]

# "y_true" corresponds to the horizontal line of the confusion matrix above ("ACTUAL VALUE")
y_true = ["cat", "cat", "cat", "cat", "fish", "dog", "cat", "cat", "cat", "cat", "cat", "cat", "fish", "fish",
          "dog", "dog", "cat", "cat", "cat", "dog", "dog", "dog", "dog", "dog", "dog"]

print(classification_report(y_true, y_pred, labels=["cat", "fish", "dog"]))
              precision    recall  f1-score   support

         cat       0.67      0.31      0.42        13
        fish       0.20      0.67      0.31         3
         dog       0.67      0.67      0.67         9

    accuracy                           0.48        25
   macro avg       0.51      0.55      0.47        25
weighted avg       0.61      0.48      0.50        25
Macro average of Precision, Recall, F1-score
There are three metrics to evaluate the performace of a trained model in the classification report:
“Precision”, “Recall” and “F1-score”.
We’ve already learned how we calculate the macro average of the metrics.
Since we have three classes for our trained model, we devide the sum of the values by three for calculating macro avarage.
Let’s review quickly how we calculated macro average of precision, recall and f1-score for our trained model.
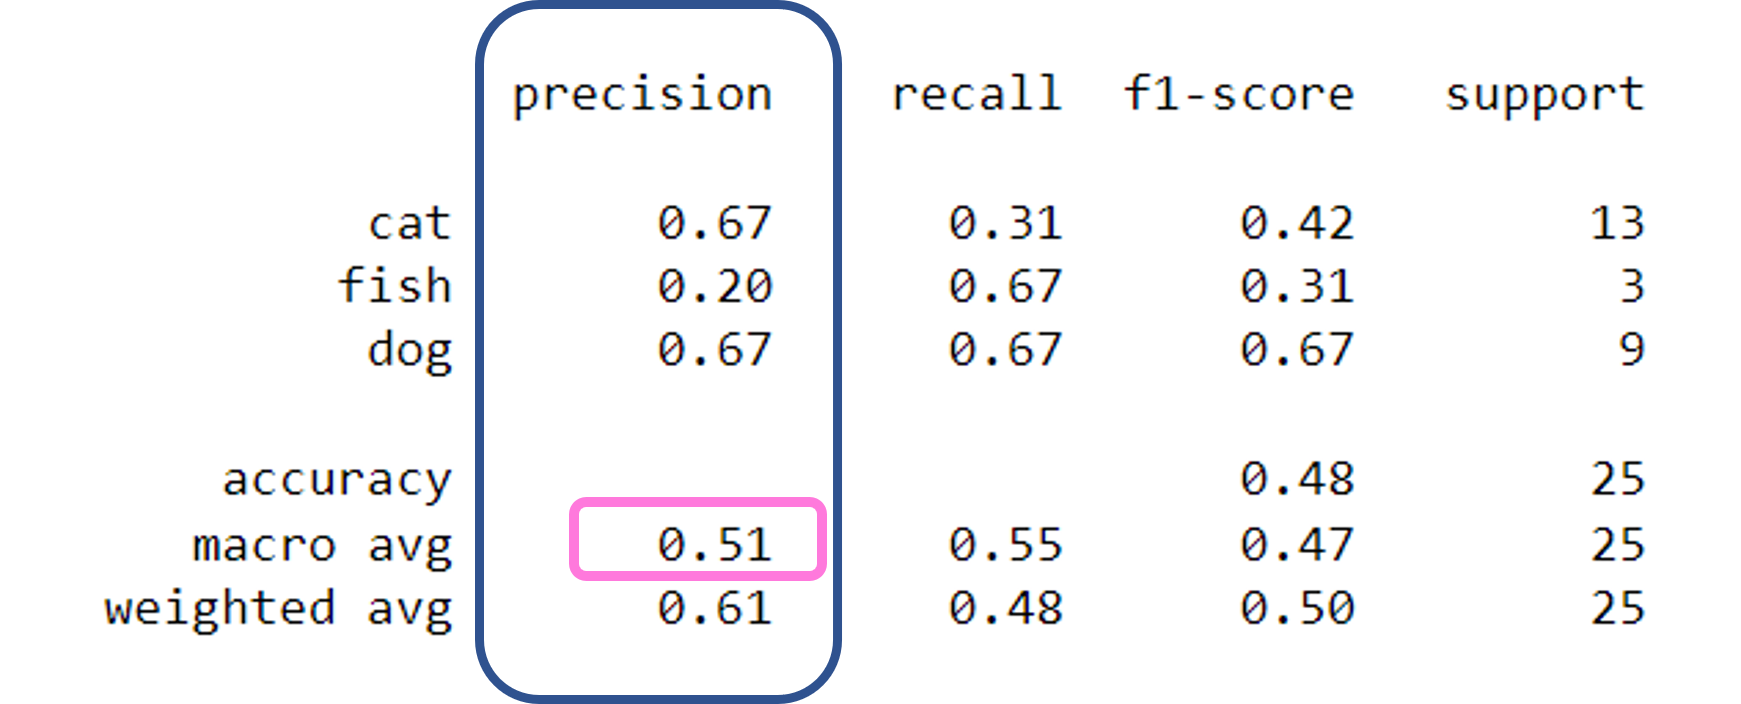
Macro average of Precision
Precision is the ratio of correctly IDENTIFIED positive cases to all PREDICTED positive cases.
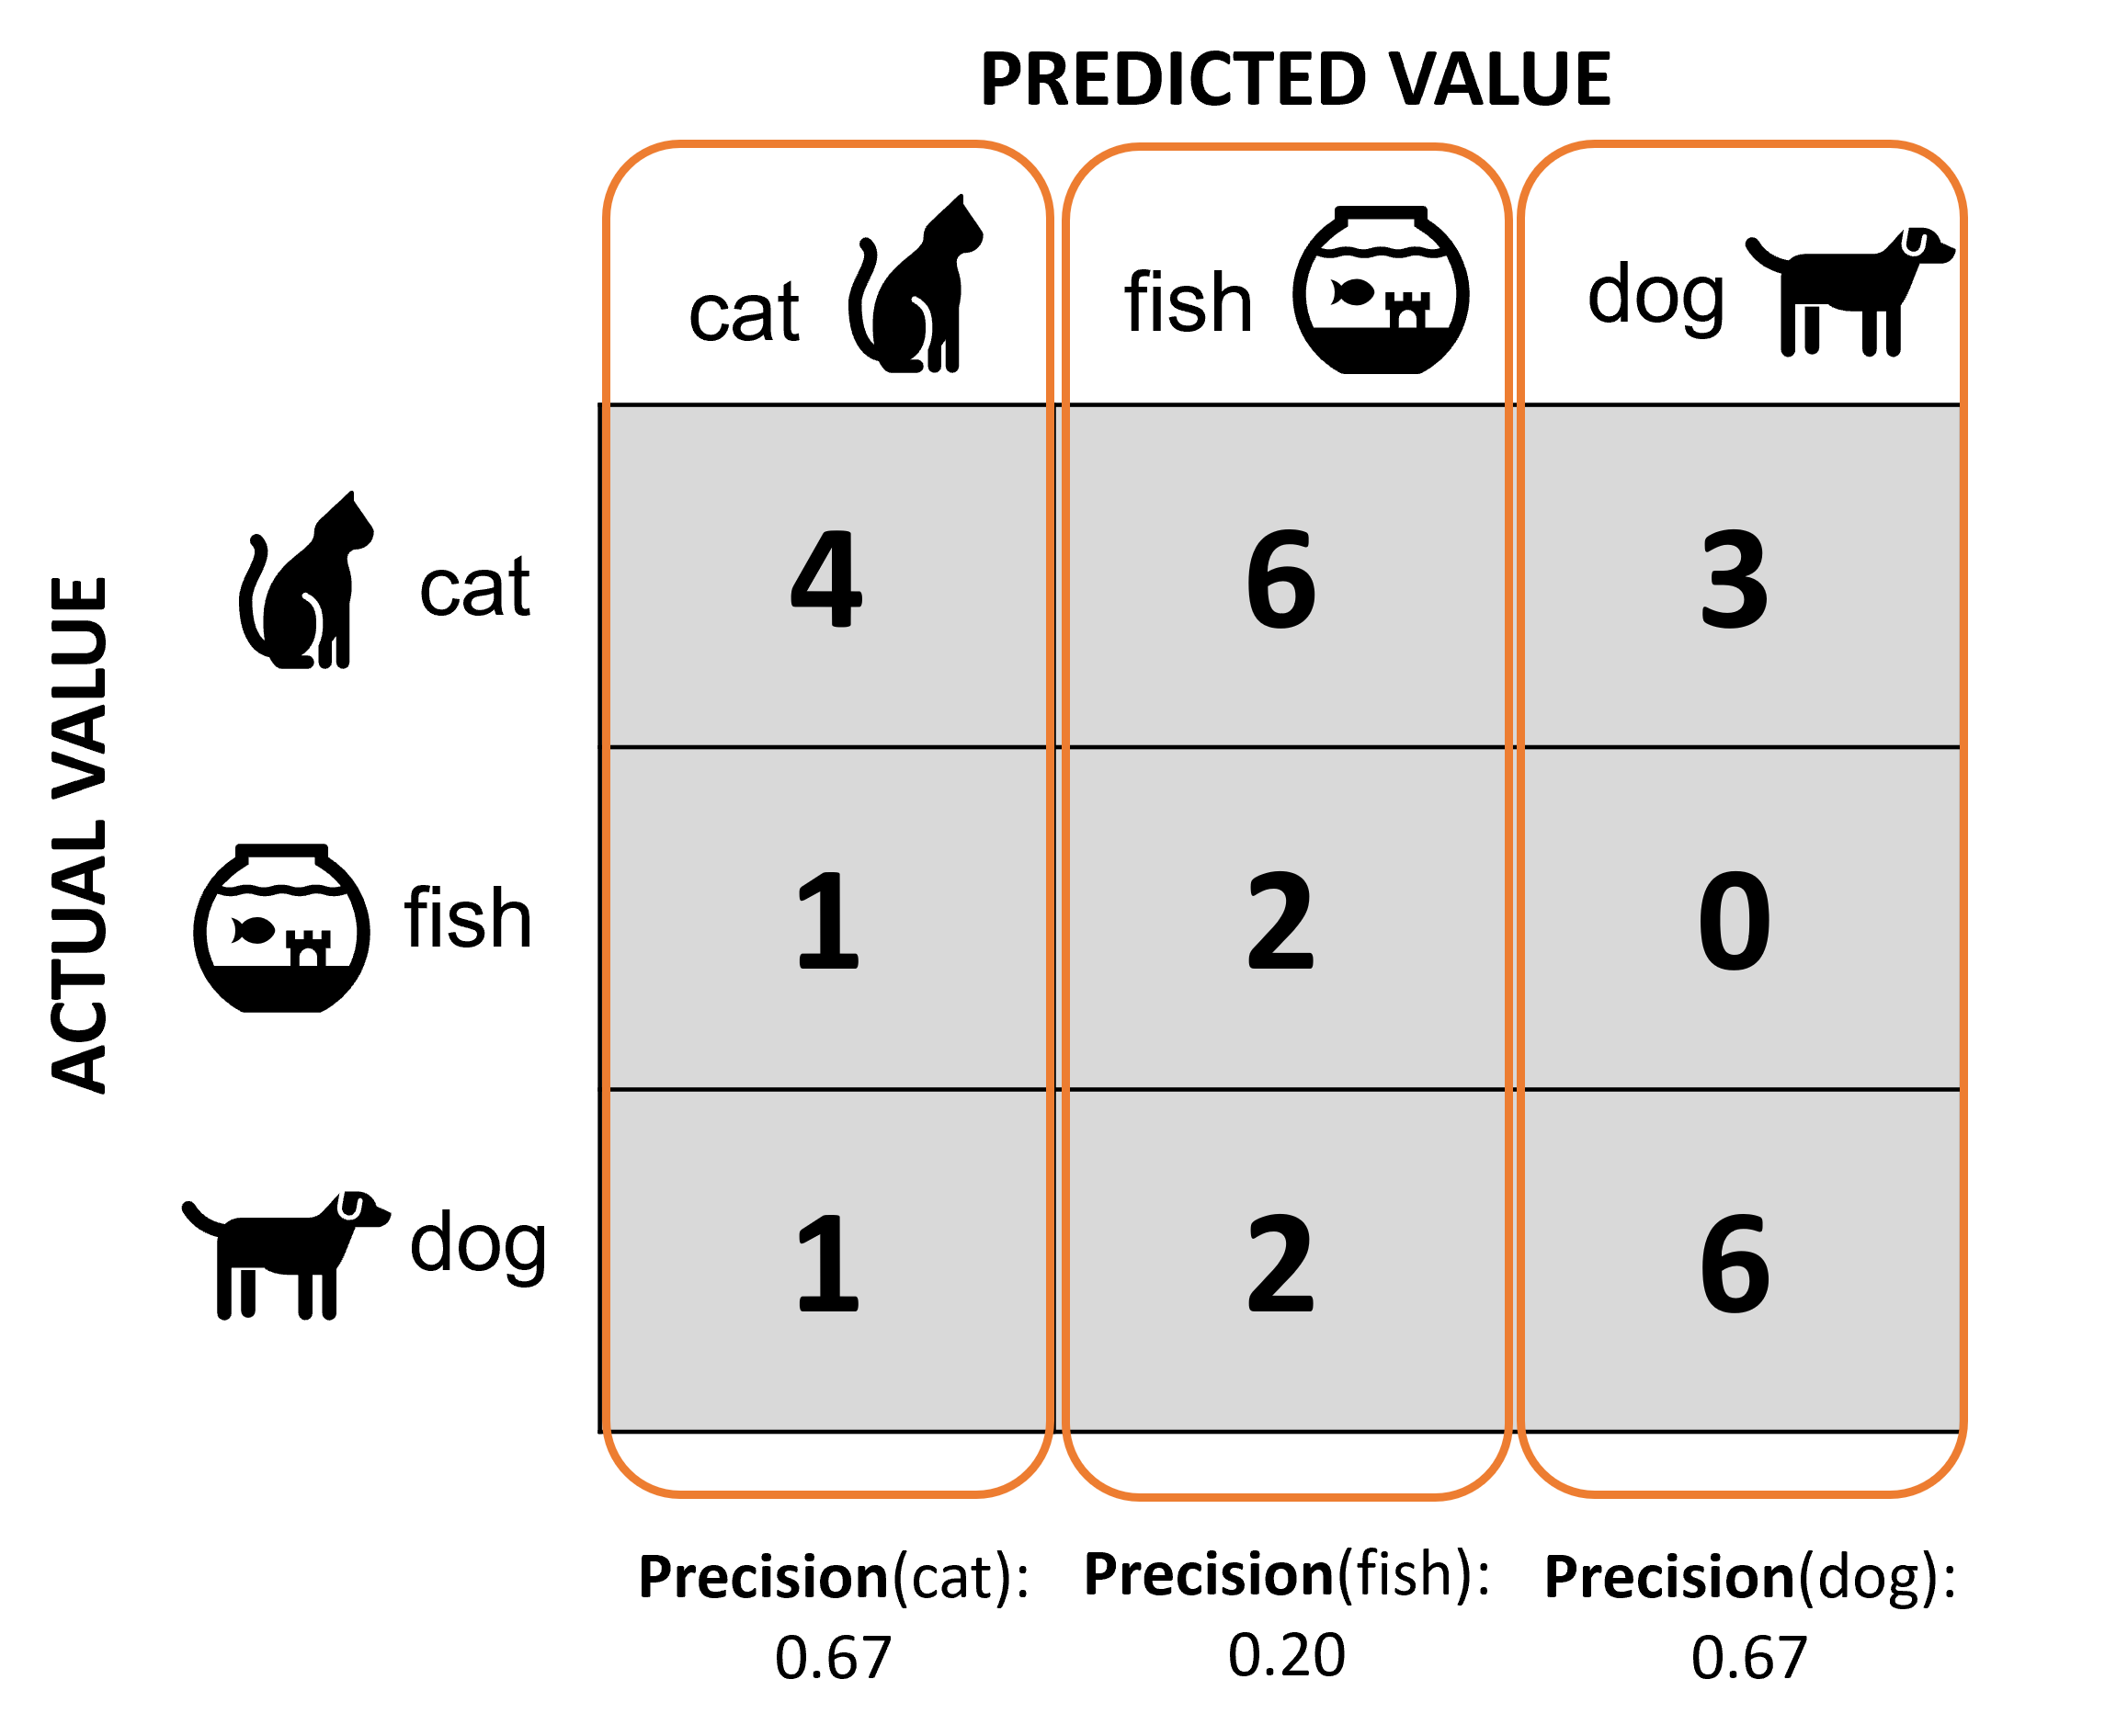
We calculate the macro average of the precision for our trained model as follows:

The precision of each class and the Macro average of them can be found in the classification report:
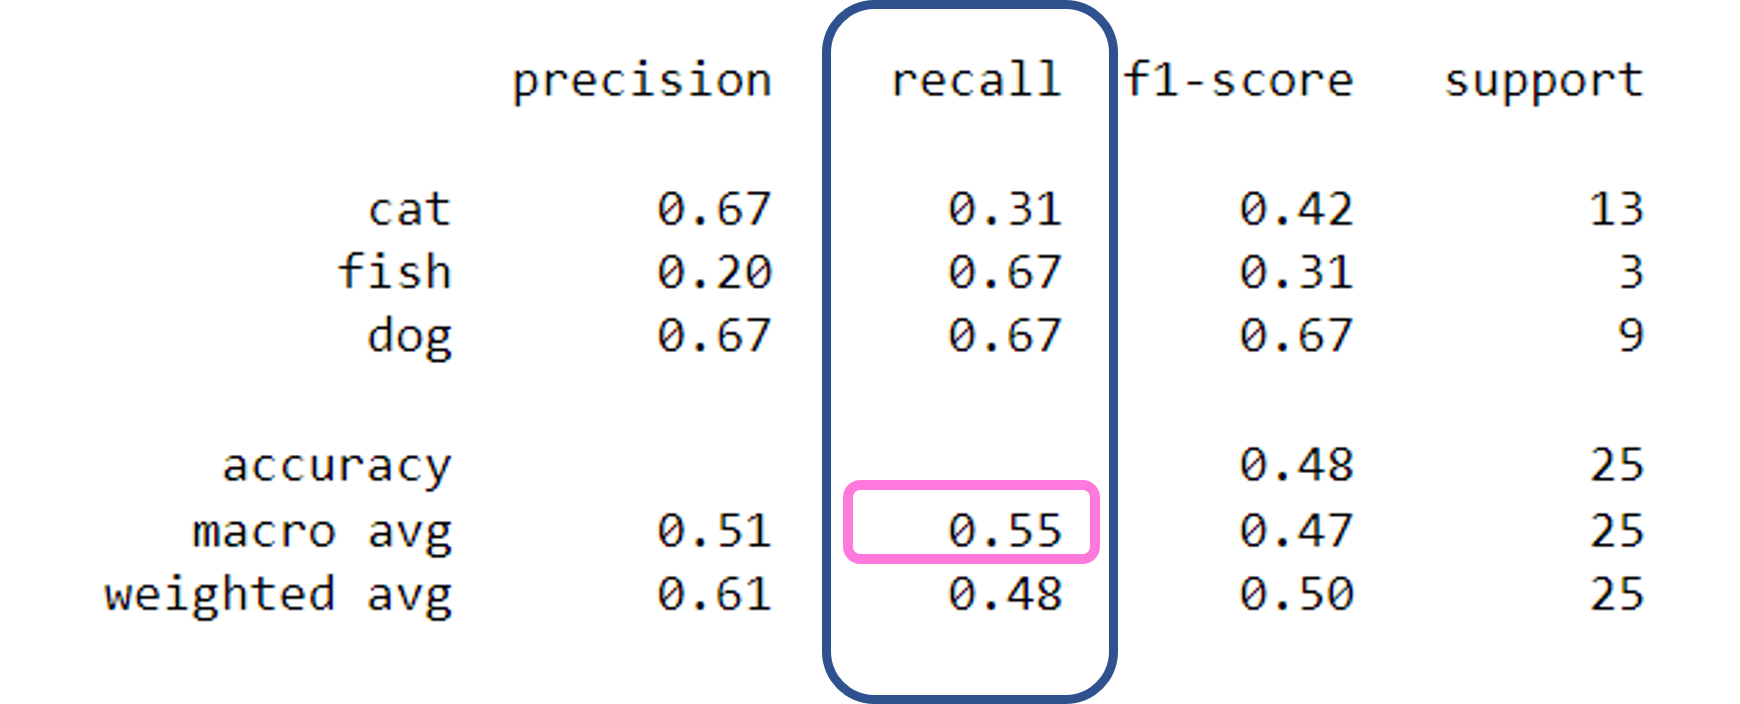
Macro average of Recall
"Recall" is the ratio of correctly IDENTIFIED positive cases to all ACTUAL positive cases.
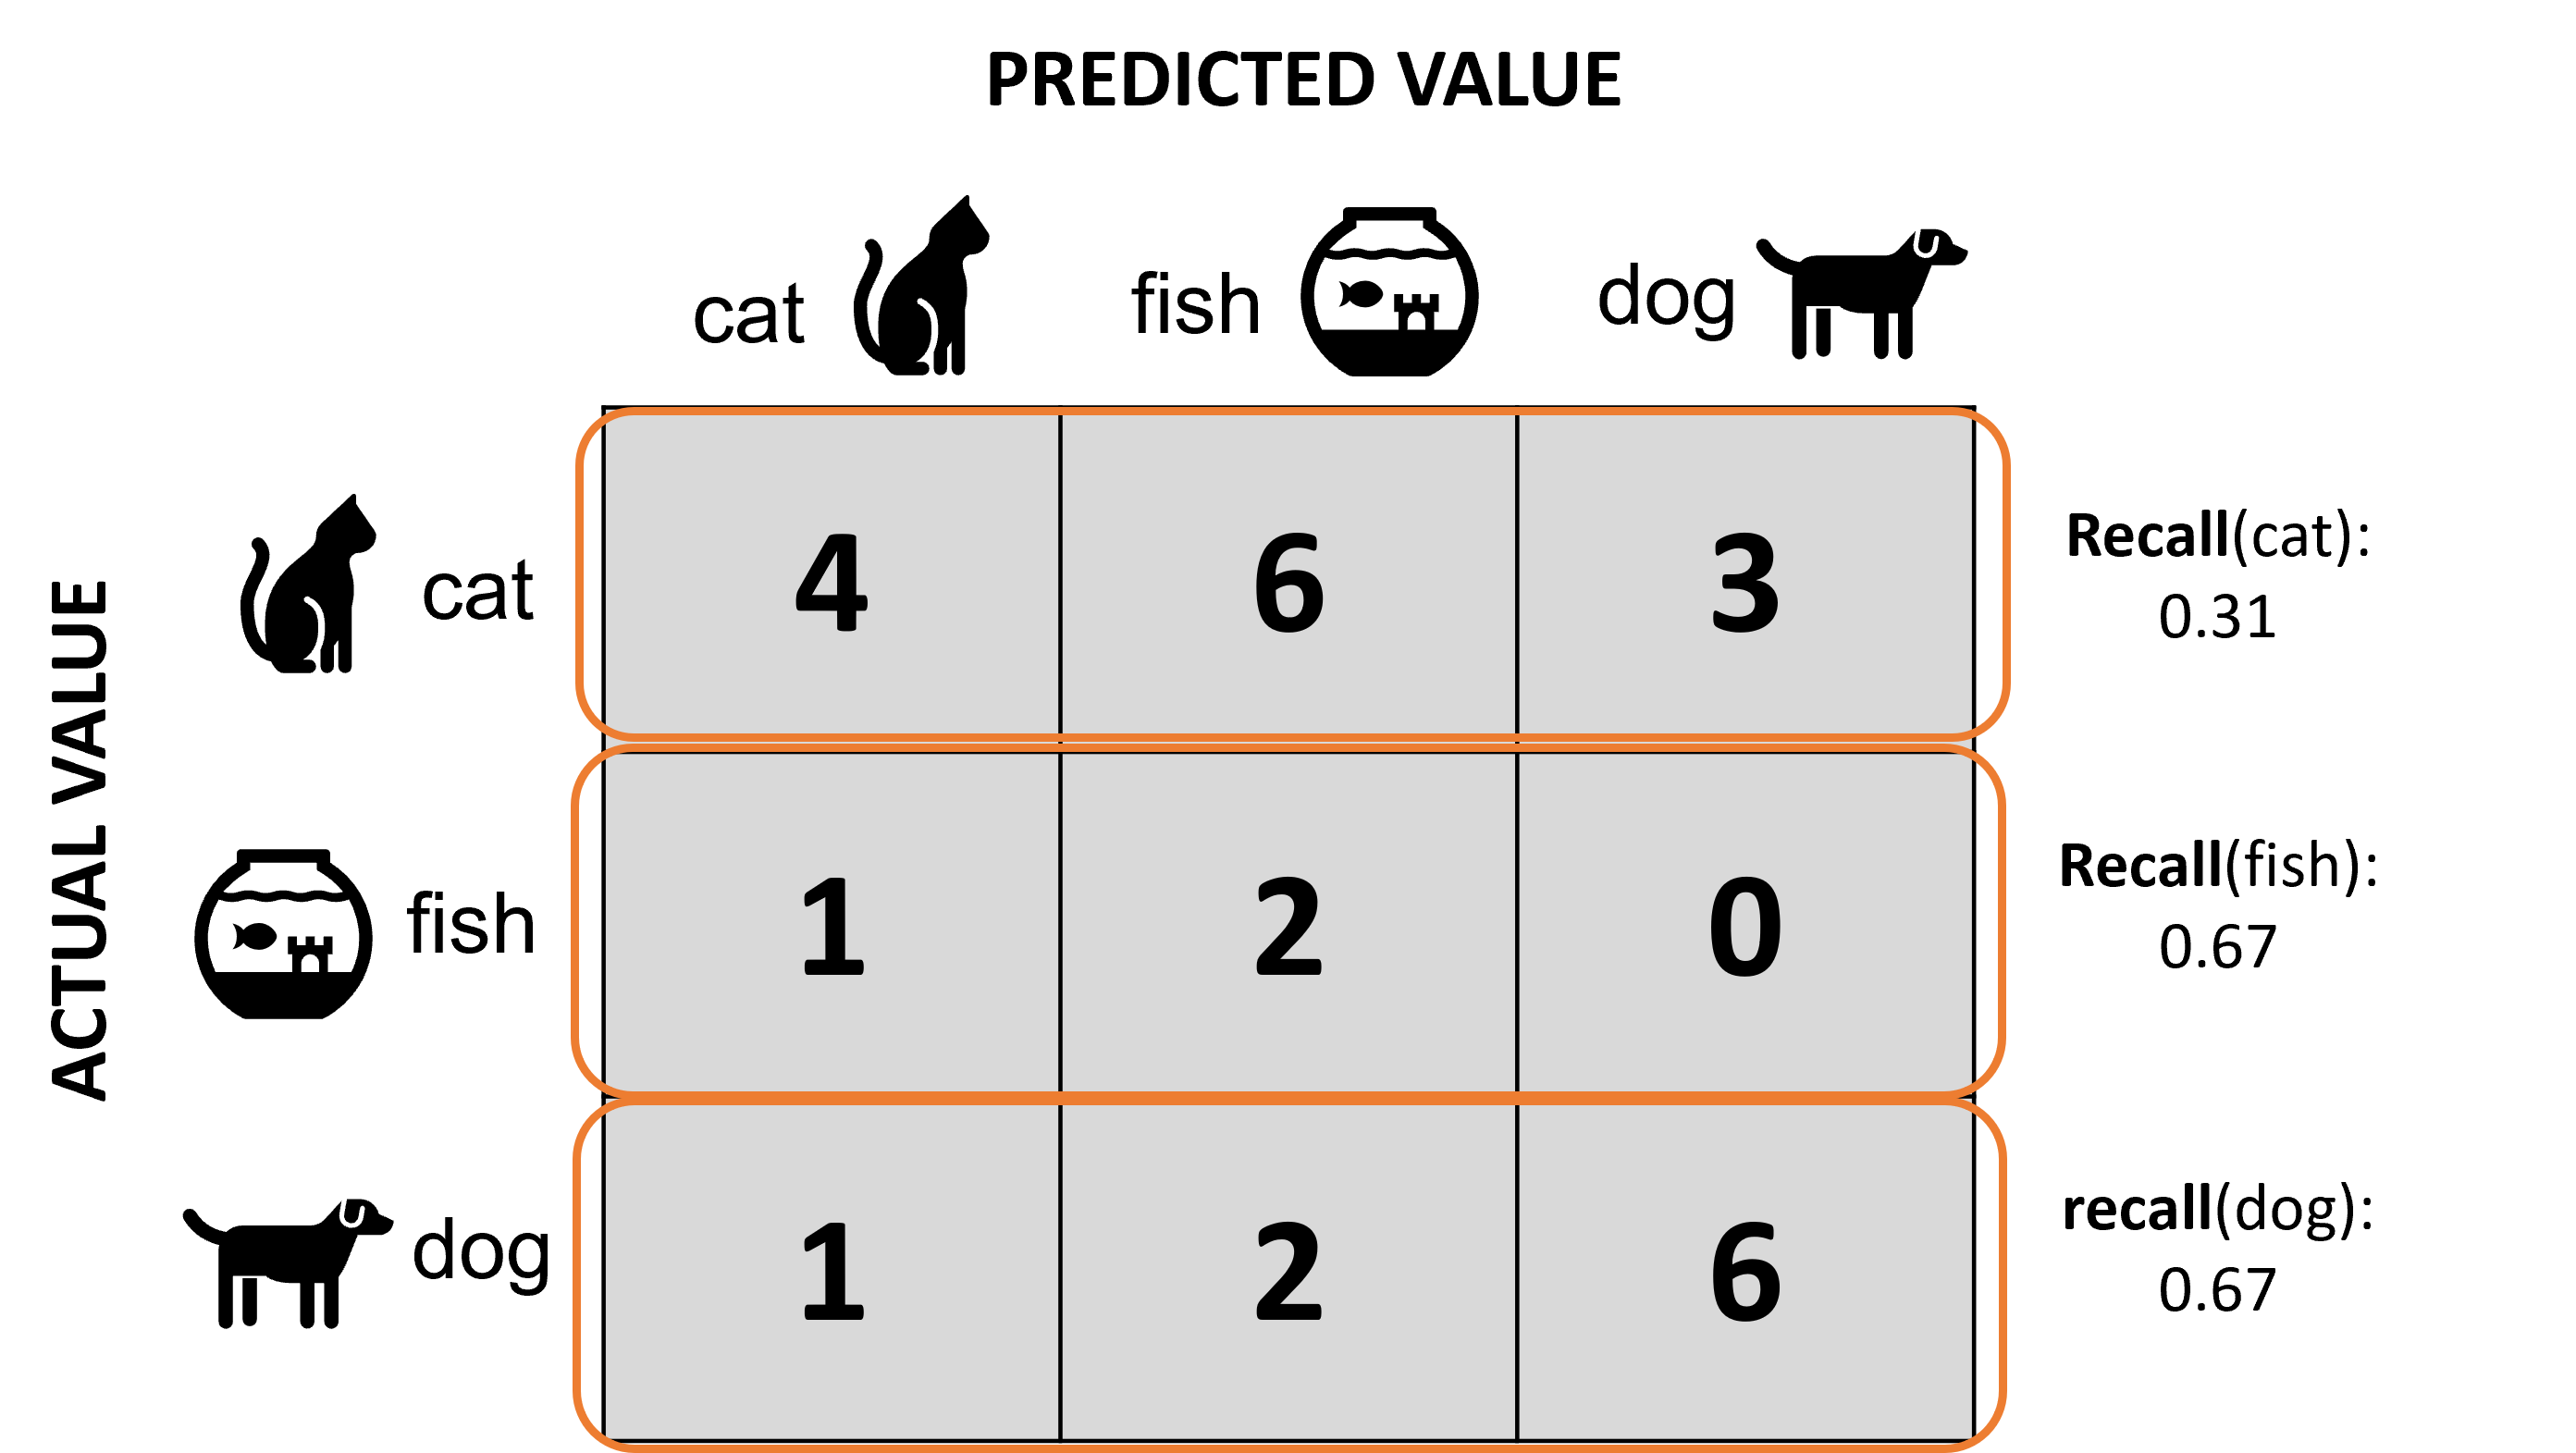
We calculate the macro average of the recall for our trained model as follows:

The recall of each class and the Macro average of them can be found in the classification report:
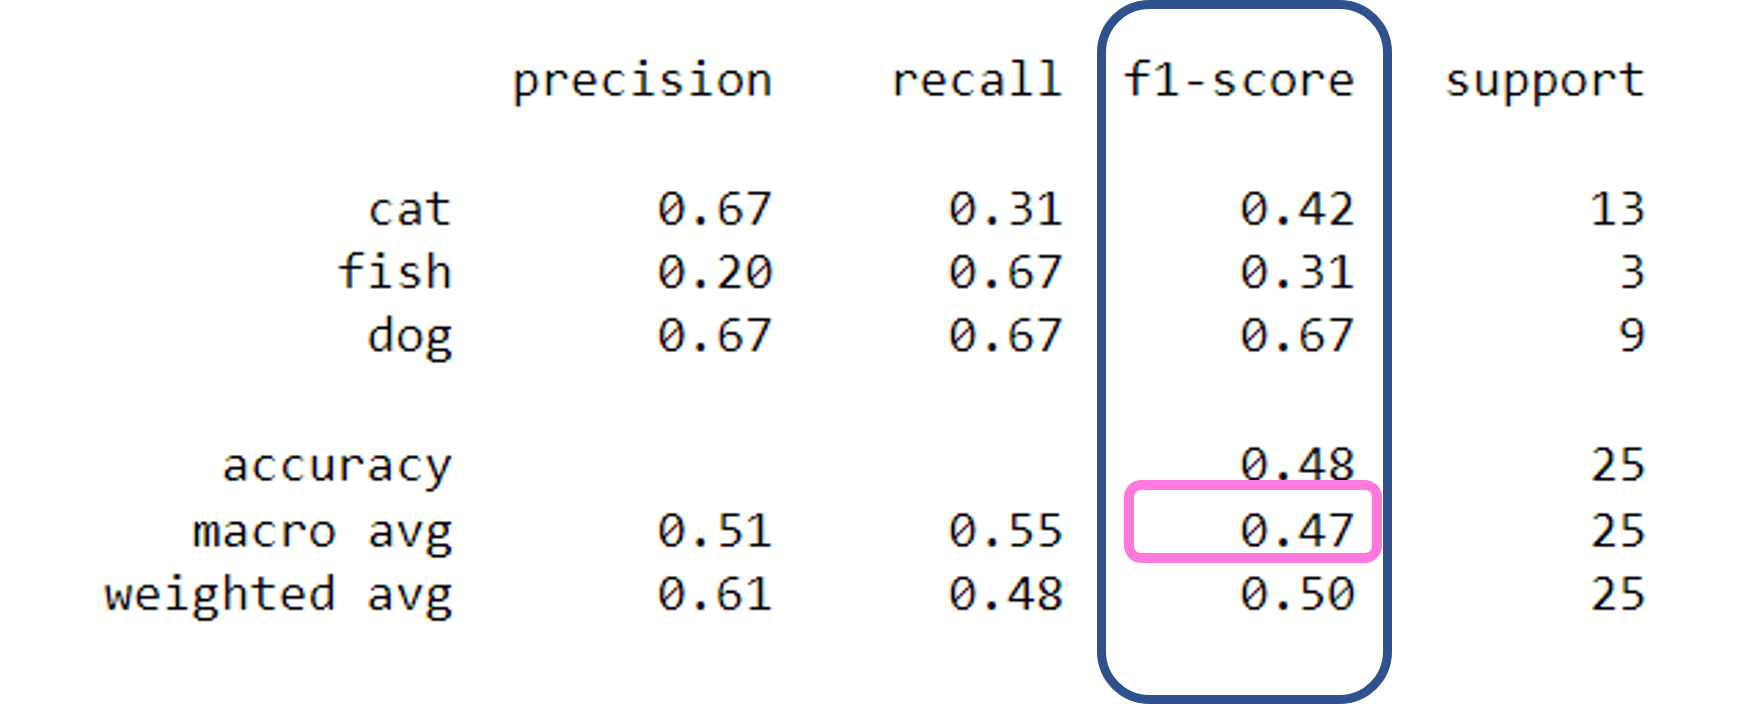
Macro average of F1-Score
"F1-Score" is the harmonic mean of “Precision” and “Recall” as we can see in the formula:

We calculate the macro average of the f1-score for our trained model as follows:

The f1-score of each class and the Macro average of them can be found in the classification report:
Weighted Average
Weighted average is a calculation that takes into account the varying degrees of importance of the numbers in a data set.
Since the weighted average takes into account the weight of each class, it can be more accurate than a macro avarage, which are simply caculated assuming the identical weight of each class.
Weighted average is especially useful for imbalanced dataset per class.
How do we know that our dataset is imbalanced?
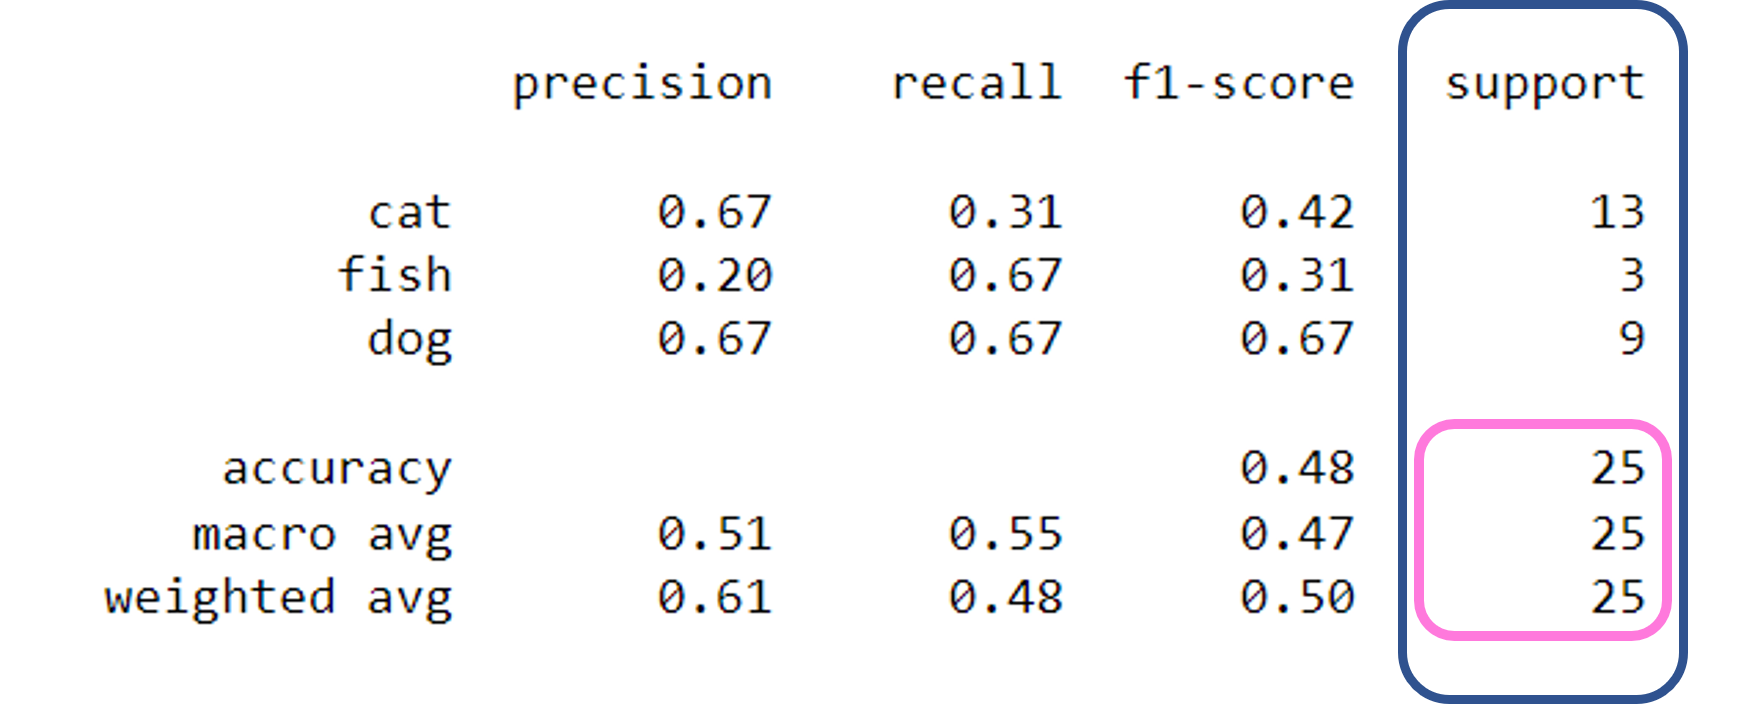
We can check the “support” in the classification report.
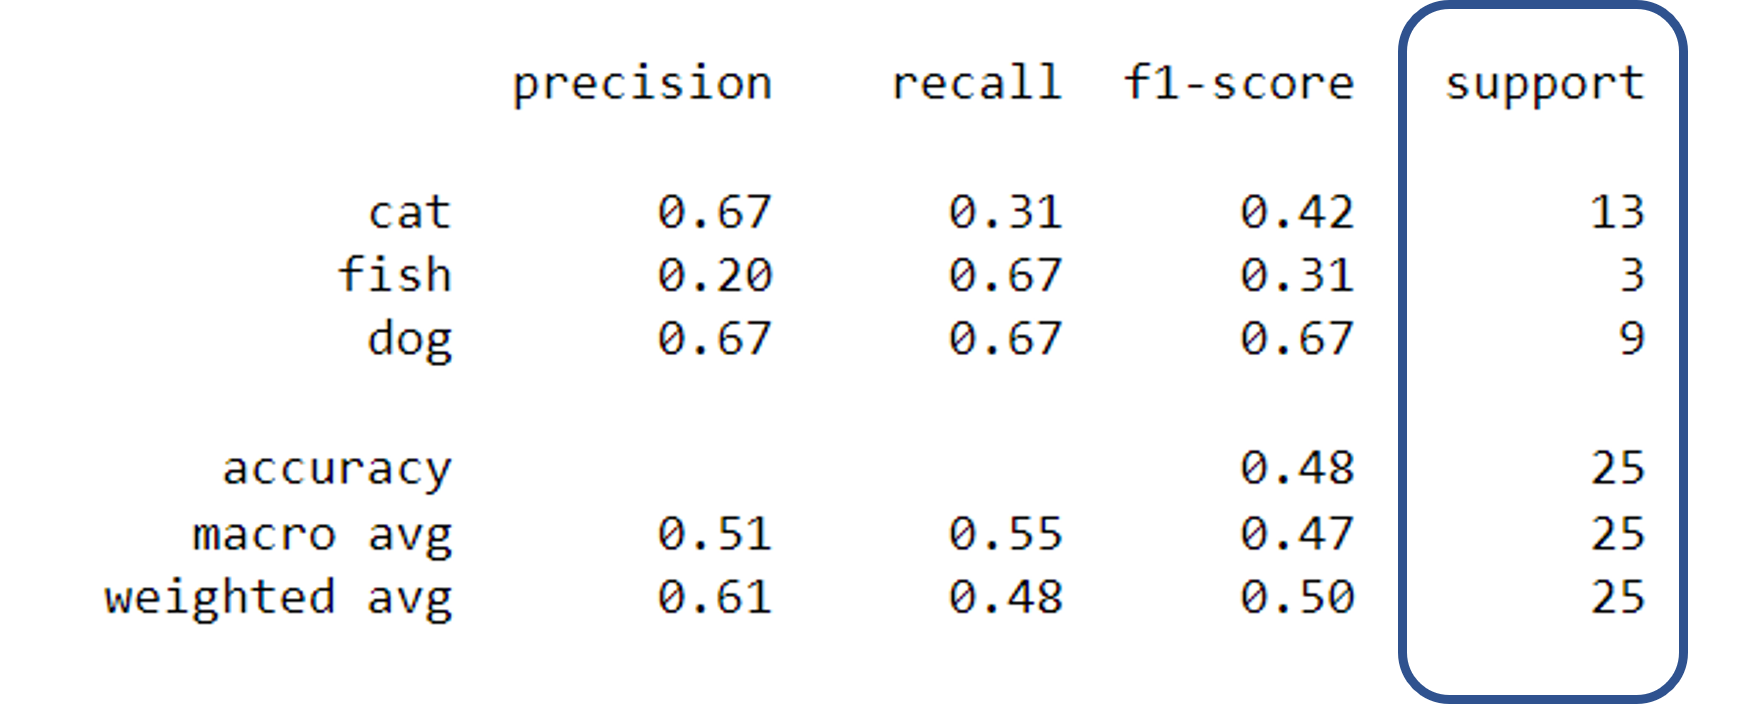
“Support” refers to the number of actual occurrences of the class in the dataset.
For example, the support value of “3” for the class “fish” means that there is only three actual occurences of the class, which corresponds to the blue marked cells in the confusion matrix below:
And the total number of training samples is “25” for every class, as it is also shown in the classification report below:
Weight of each class
Our training dataset is imbalanced because the actual occurences are quite different per class, as shown in the classification report.
Then how we can calculate the weight of each class?
The “weight” essentially refers to the proportion of each class’s support relative to the sum of all support values.
We just can devide the actual occurences by the total number of training samples per class as follows:
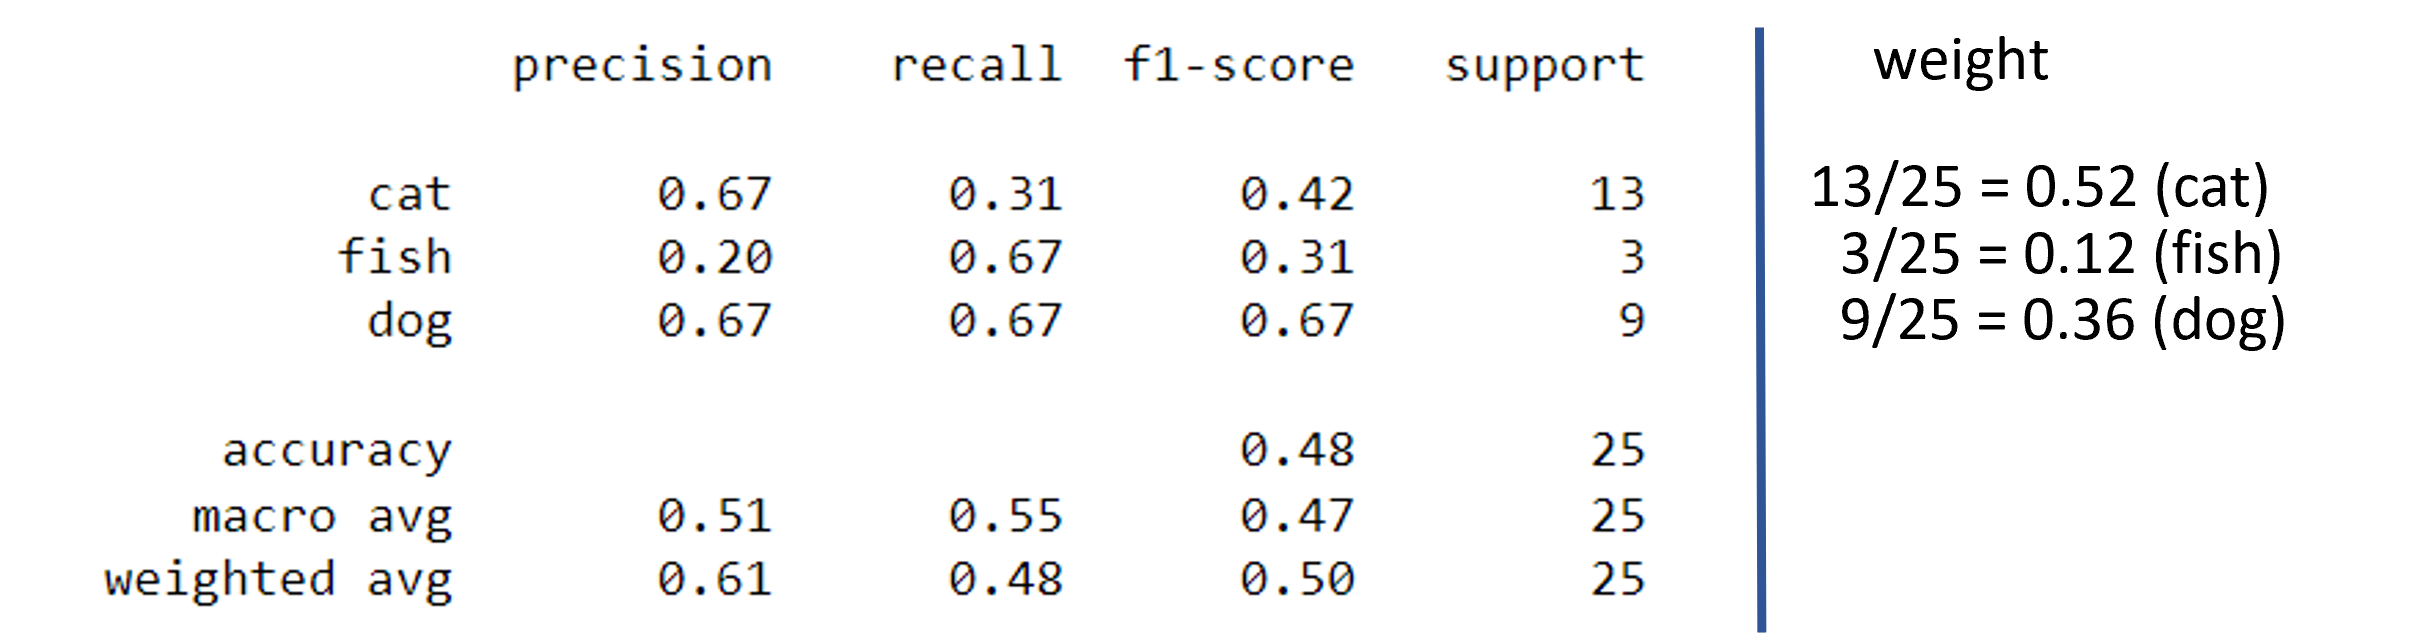
Higher weight for a class like “cat” (“0.52”) means it has higher importance than other classes while lower weight for a class like “fish” (“0.12”) means it has lower importance than other classes when training the model.
Weighted Average of F1-score
If we learn how to calculate the weighted average of F1-score, we can also calculate it for precision and recall.
So let’s focus on the weighted average f1-score.
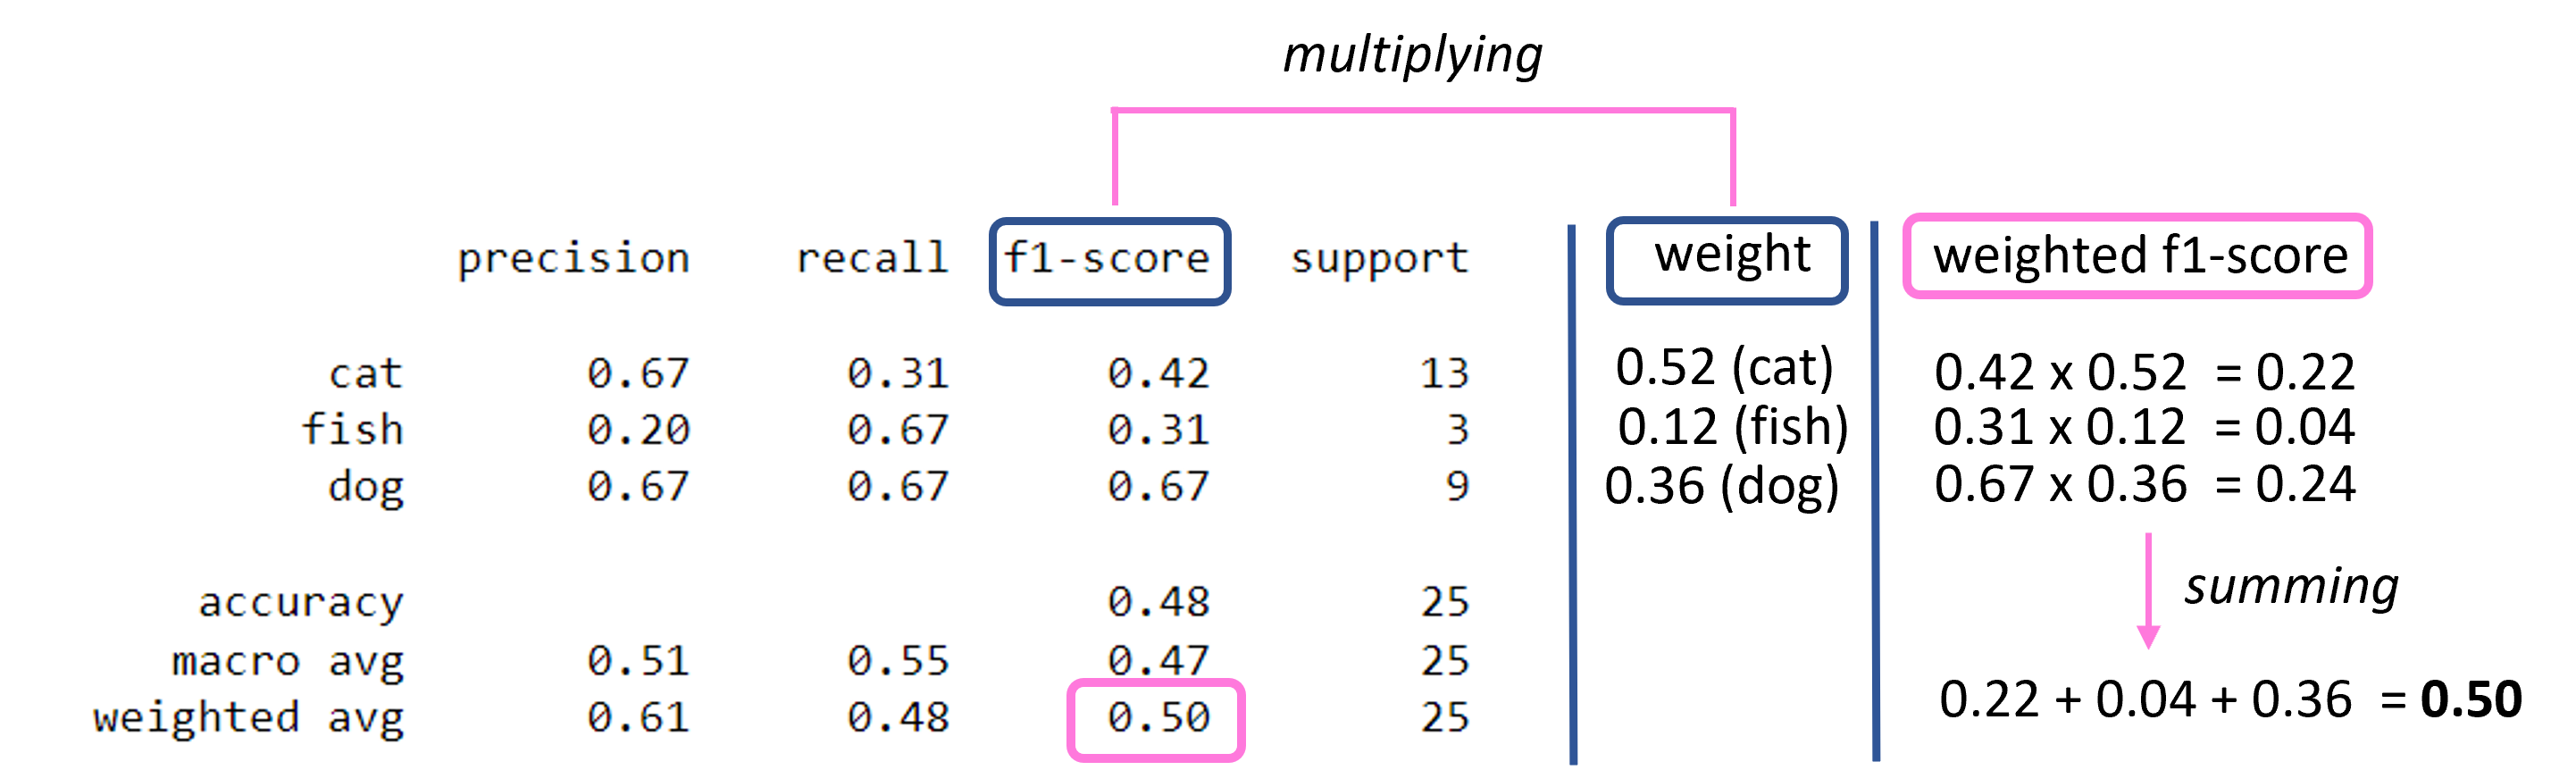
We can calculate the weighted average of f1-score by multiplying the f1-score with the weight for each class and summing them up:
Recap
We’ve learned how to evaluate the macro and weighted avearage of three metrics for our trained model.
Macro averaging is the averaging method assuming the identical weights of each class while weighted averaging is the averaging method taking into account the weights of each class.
Try to calculate the weigted average of precision and recall for our trained model and compare the results with the classification report above.
Hope you enjoy the journey :)
References
- Reference1: Micro, Macro & Weighted Averages of F1 Score, Clearly Explained
- Reference2: sklearn.metrics.classification_report
- Reference3: Classification Report
- Reference4: Weighted Average: What Is It, How Is It Calculated and Used?